Question 74
Study the given pie chart and table and answer the question that follows.
The pie chart represents the percentage-wise distribution of 300 students of class X in a school in six different sections A, B, C, D, E and F.

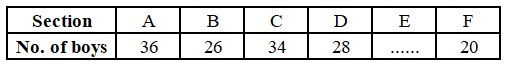
The table shows the number of boys of class X in six different sections A, B, C, D, E and F.
The difference between the central angles of the sectors corresponding to the sections A and F is:
Create a FREE account and get:
- Free SSC Study Material - 18000 Questions
- 230+ SSC previous papers with solutions PDF
- 100+ SSC Online Tests for Free


