Question 74
Bar graph shows the number of students enrolled for a vocational course in institutes A and B during 5 years.
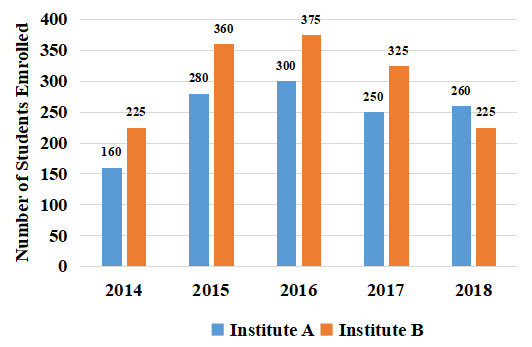
The average number of students enrolled in institute A during 2014, 2016 and 2018 is what percent less than the number of students enrolled in institute B during 2017 (correct to two decimal places)?
Create a FREE account and get:
- Free SSC Study Material - 18000 Questions
- 230+ SSC previous papers with solutions PDF
- 100+ SSC Online Tests for Free


