Question 70
Study the given bar graphs and answerthe question that follows.
The bar graphs represent the amountinvested in raw materials (in ₹ crore) and the sale of the products, by a textile company in the years 2007— 2012. The X-axis represents the years. The Y-axis
represents the amount invested in raw materials (in ₹ crore) in figure 1 and sale of products in figure 2, respectively.
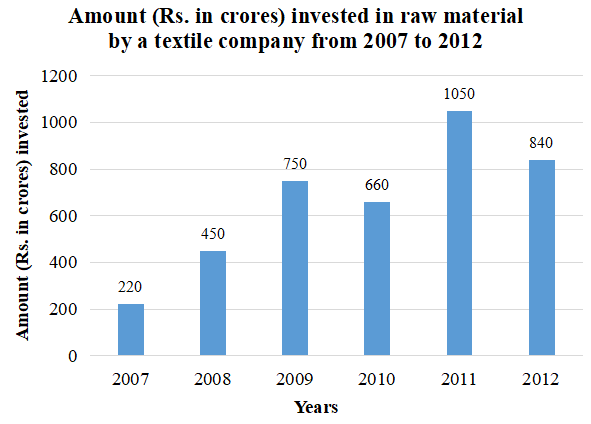
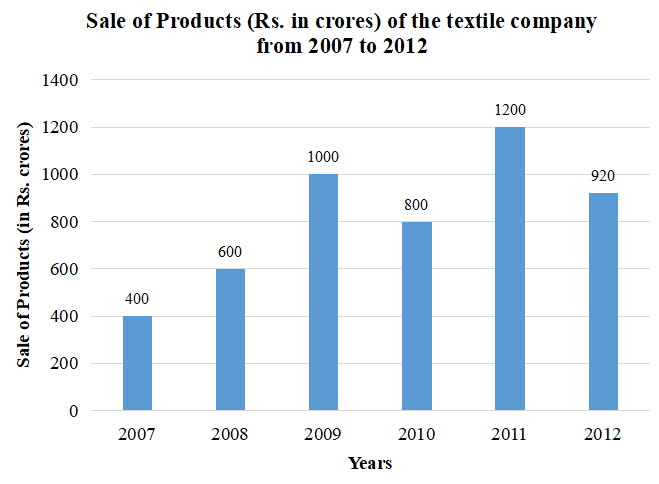
The sum of the amounts invested during the years 2007, 2008 and 2010 is what percentage (correct to one decimal place) of the sum of the sales of products during 2009 and 2011?
Create a FREE account and get:
- Free SSC Study Material - 18000 Questions
- 230+ SSC previous papers with solutions PDF
- 100+ SSC Online Tests for Free


