Sign in
Please select an account to continue using cracku.in
↓ →
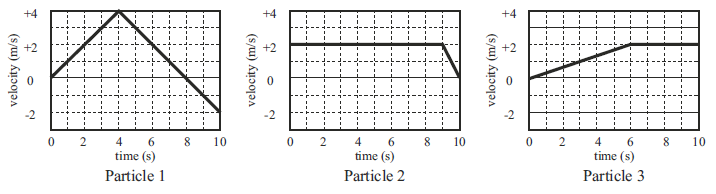
In the following figures the velocity-time graphs for three particles 1, 2 and 3 are shown. The magnitude of average acceleration of the three particles, over 10 s, bear the relationship


Predict your JEE Main percentile, rank & performance in seconds

Educational materials for JEE preparation

Ask our AI anything

AI can make mistakes. Please verify important information.
AI can make mistakes. Please verify important information.

 91- 6303239042
 Diwali Dhamaka Sale