Question 59
The following Bar Graphs represent the Export of Tea (in lakh tonnes) by two companies A and B during the years 2010 to 2015.
Study the chart and answer the question written below:
(Note: The data shown below is only for mathematical exercise. They do not represent the actual figures).
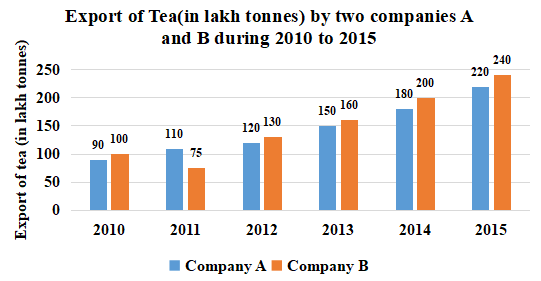
What is the ratio of the total exports of company B in 2011 and 2014 to the total exports of company A in 2012 and 2015?
Create a FREE account and get:
- Free SSC Study Material - 18000 Questions
- 230+ SSC previous papers with solutions PDF
- 100+ SSC Online Tests for Free


