Question 54
Study the given bar graph and answer the question that follows.
A soft drink company prepares drinks of three different flavours A, B and C. The bar graph shows the production of three flavours over a period of five years from 2010 to 2014.
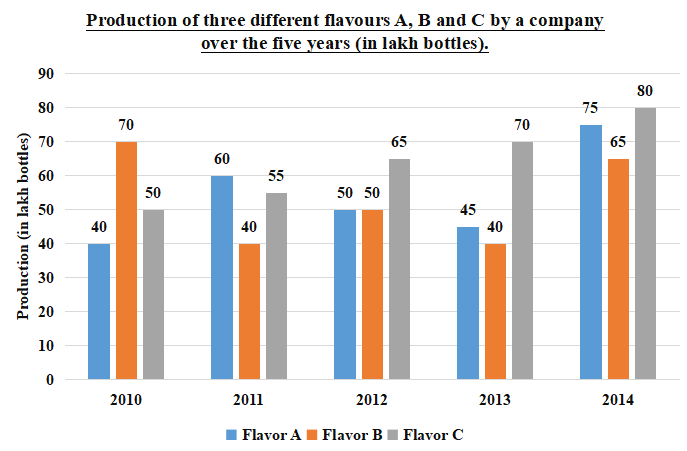
For which of the following years. is the percentage of the rise in production compared to its previous year the maximum with respect to flavour C?
Create a FREE account and get:
- Free SSC Study Material - 18000 Questions
- 230+ SSC previous papers with solutions PDF
- 100+ SSC Online Tests for Free


