Instructions

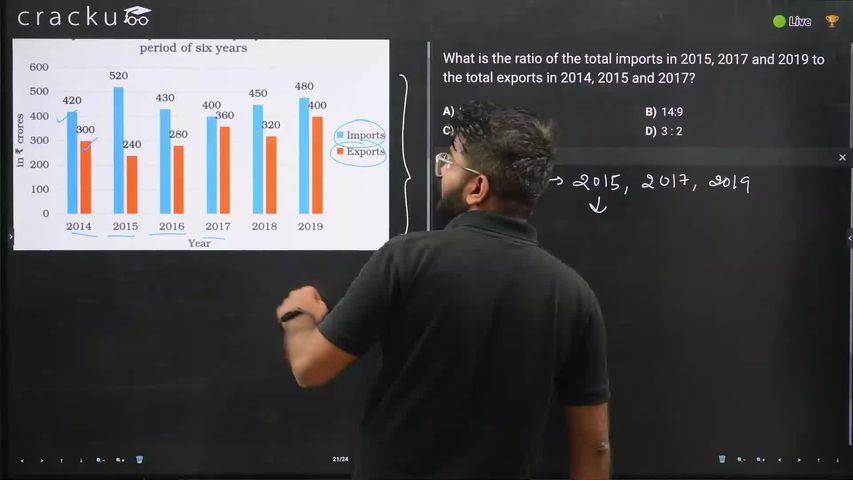
Study the given bar graph and answer the question that follows.
Question 52
The average exports (per year) in 2015, 2018 and 2019 are approximately what percentage less than the imports in 2018?
Solution
average exports (per year) in 2015, 2018 and 2019 : (240+320+400)/3 = 320
Imports in 2018: 450
Difference = 130
Difference percentage = (130/450)*100 = 28.9%
Get AI Help
Video Solution
Click on the Email ☝️ to Watch the Video Solution

SRCC Quant Questions | SRCC Quantitative Ability
SRCC DILR Questions | LRDI Questions For SRCC
SRCC Verbal Ability Questions | VARC Questions For SRCC
Free SRCC DILR Questions
Book Free CAT Mentorship
Get personalized CAT strategy from a 99%iler
500+ students mentored
OTP Verification
Enter the 6-digit code sent to your phone
Booking Summary
Session:Free CAT Mentorship
Phone:
Date:
Time:
Enter OTP
Didn't receive the OTP?


