Instructions

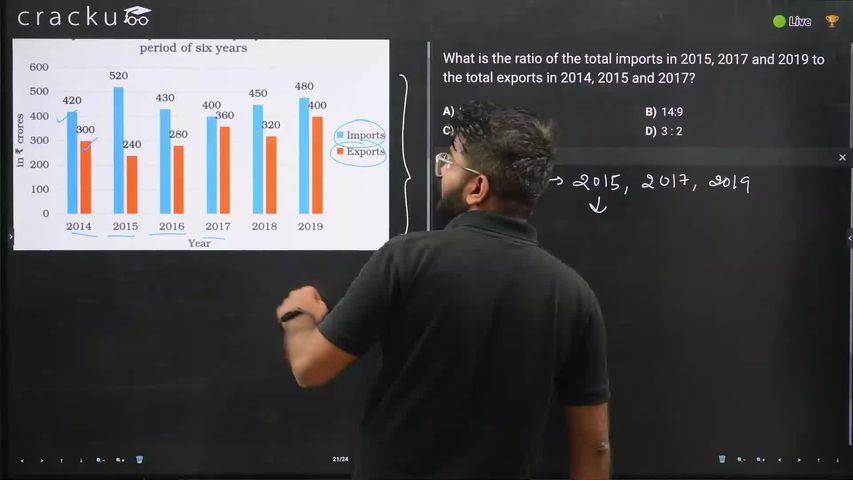
Study the given bar graph and answer the question that follows.
Question 50
In which year(s) was/were the exports less than the imports by p%, where p lies between 25 and 30?
Solution
We need to find the difference between imports and exports as a percentage of Imports for each year:
2014: Difference = 120
Percentage = (120/420)*100 = 28.57%
2015: Difference = 280
Percentage = (280/520)*100 = 53.84%
2016: Difference = 150
Percentage = (150/430)*100 = 34.88%
2017: Difference = 40
Percentage = (40/400)*100 = 10%
2018: Difference = 130
Percentage = (130/450)*100 = 28.89%
2019: Difference = 80
Percentage = (80/480)*100 = 16.67%
So the change in percentage for 2014 and 2018 is between 25% to 30%.
Get AI Help
Video Solution
Click on the Email ☝️ to Watch the Video Solution


