Instructions

Study the given bar graph and answer the question that follows.
Question 49
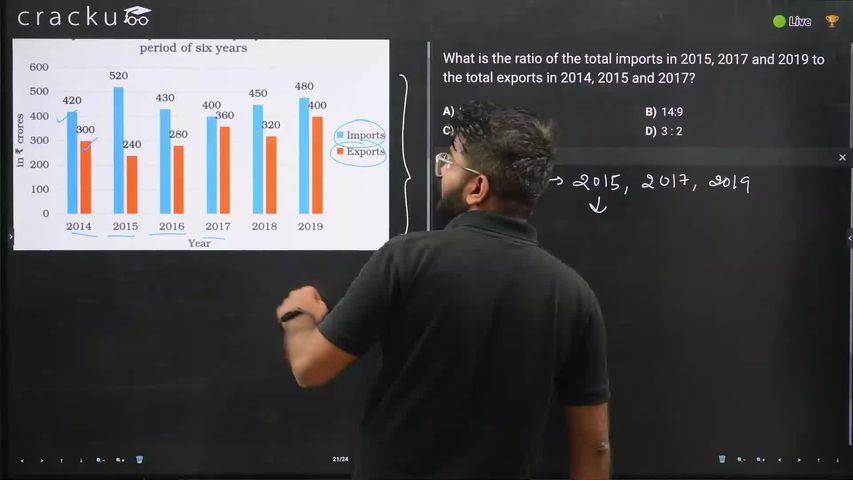
What is the ratio of the total imports in 2015, 2017 and 2019 to the total exports in 2014, 2015 and 2017?
Solution
Imports in 2015,17, and 19 is 520, 400, 480. Exports in 2014, 15, and 17 are 300, 240, 360.
Imports = 520+400+480=1400
Exports = 300+240+360=900
1400:900=14:9
Get AI Help
Video Solution
Click on the Email ☝️ to Watch the Video Solution

SRCC Quant Questions | SRCC Quantitative Ability
SRCC DILR Questions | LRDI Questions For SRCC
SRCC Verbal Ability Questions | VARC Questions For SRCC
Free SRCC DILR Questions
Book Free CAT Mentorship
Get personalized CAT strategy from a 99%iler
500+ students mentored
OTP Verification
Enter the 6-digit code sent to your phone
Booking Summary
Session:Free CAT Mentorship
Phone:
Date:
Time:
Enter OTP
Didn't receive the OTP?


