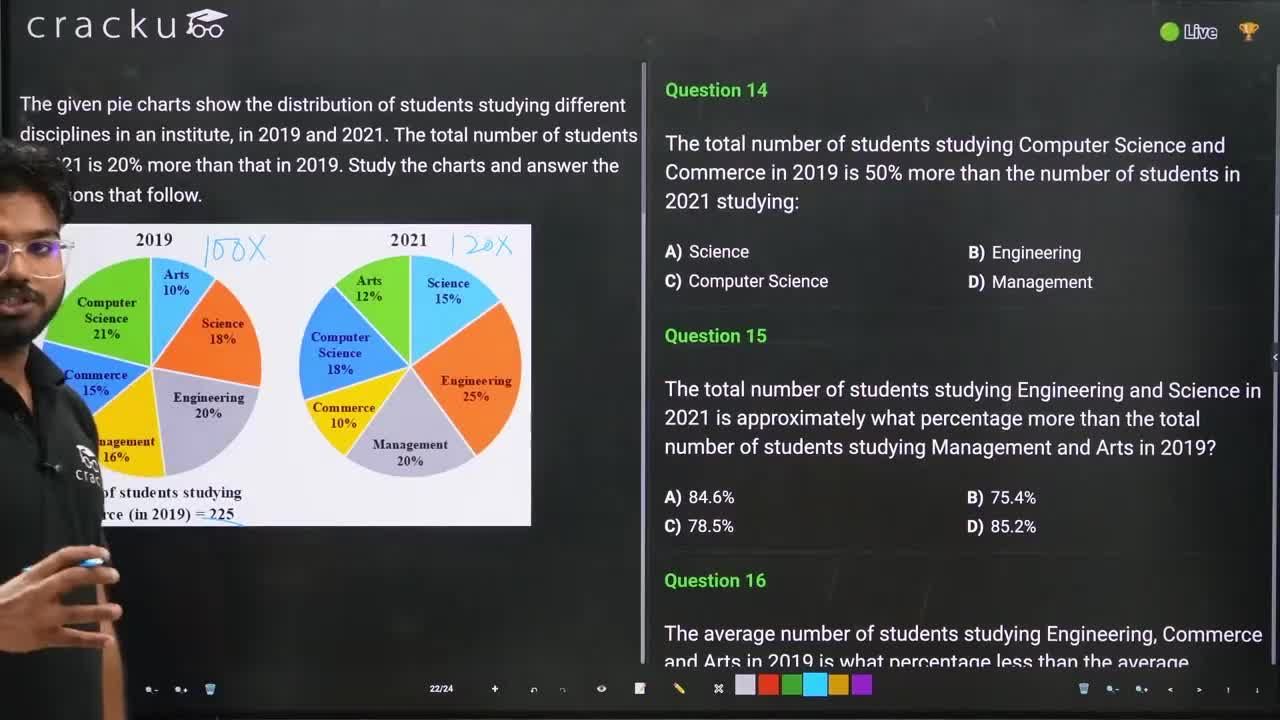
The given pie charts show the distribution of students studying different disciplines in an institute, in 2019 and 2021. The total number of students in 2021 is 20% more than that in 2019. Study the charts and answer the questions that follow.

The average number of students studying Engineering, Commerce and Arts in 2019 is what percentage less than the average number of students studying Management, Computer Science and Science in 2021? (Nearest to an integer)
Solution
The required figure is given below:
Let the total number of students in 2019 be $$x$$.
Number of Commerce students = $$15\%\ of\ x=225$$ (given)
$$x=1500$$
Number of students in 2021 increased by 20% as compared to 2019.
Total number of students in 2021 = $$1500\times\left(1+20\%\right)=1800$$
In 2019,
Number of students in Computer Science = 21% of 1500 = 315
Number of students in Arts = 10% of 1500 = 150
Number of students in Science = 18% of 1500 = 270
Number of students in Engineering = 20% of 1500 = 300
Number of students in Management = 16% of 1500 = 240
Number of students in Commerce = 225 (given)
In 2021,
Number of students in Computer Science = 18% of 1800 = 324
Number of students in Arts = 12% of 1800 = 216
Number of students in Science = 15% of 1800 = 270
Number of students in Engineering = 25% of 1800 = 450
Number of students in Management = 20% of 1800 = 360
Number of students in Commerce = 10% of 1800 = 180
Average number of students studying Engineering, Commerce and Arts in 2019 = $$\ \dfrac{300+225+150}{3}=225$$
Average number of students studying Management, Computer Science and Science in 2021 = $$\ \dfrac{360+324+270}{3}=318$$
Difference in the number of students = 318 - 225 = 93
Percentage difference = $$\ \dfrac{93}{318}\times100=29.24\%$$
Hence, the average number of students studying Engineering, Commerce and Arts in 2019 is 29.24% less than the the average number of students studying Management, Computer Science and Science in 2021.
$$\therefore\ $$ The required answer is C.
Get AI Help
Video Solution
Click on the Email ☝️ to Watch the Video Solution

SRCC Quant Questions | SRCC Quantitative Ability
SRCC DILR Questions | LRDI Questions For SRCC
SRCC Verbal Ability Questions | VARC Questions For SRCC
Free SRCC DILR Questions
Book Free CAT Mentorship
Get personalized CAT strategy from a 99%iler
500+ students mentored
OTP Verification
Enter the 6-digit code sent to your phone
Booking Summary
Enter OTP
Didn't receive the OTP?


