Sign in
Please select an account to continue using cracku.in
↓ →
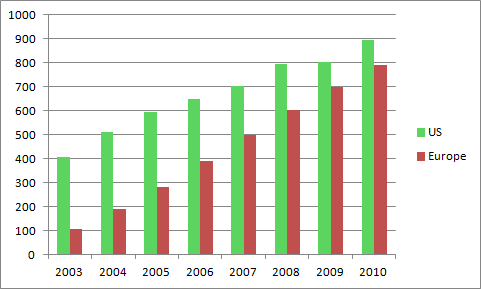
Directions for the following four questions: Answer the following questions based on the information given below: The bar chart below shows the revenue received in million US Dollars (USD), from subscribers to a particular Internet service. The data covers the period 2003 to 2007 for the United States (US) and Europe. The bar chart also shows the estimated revenues from subscription to this service for the period 2008 to 2010.
The Y axis represents the subscription revenue in Million (USD) and the X axis represents the years.
In 2003, sixty percent of subscribers in Europe were men. Given that women subscribers increase at the rate of 10 percent annum and men at the rate of 5 percent per annum, what is the approximate percentage growth of subscribers between 2003 and 2010 in Europe? The subscription prices are volatile and may change each year.

Suppose there are 100 subscribers from europe in the year 2003.
Out of which 60 are men and 40 are women.
According to given condition in the year 2010 no. of male subscribers would be 60*$$1.05^7$$ = 84 and no. of female subscribers would be 40*$$1.1^7$$ = 78.
So total equal to 162.
Hence % increase is 100*(162-100)/100 = 62.
Hence option A.
Create a FREE account and get:
Book Free CAT Mentorship
Get personalized CAT strategy from a 99%iler
500+ students mentored
OTP Verification
Enter the 6-digit code sent to your phone
Booking Summary
Enter OTP
Didn't receive the OTP?

Educational materials for CAT preparation

Ask our AI anything

AI can make mistakes. Please verify important information.
AI can make mistakes. Please verify important information.


