Sign in
Please select an account to continue using cracku.in
↓ →
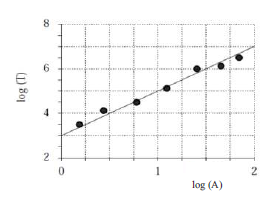
The log-log graph for a non-linear oscillator is shown below. Assuming the constants to have appropriate dimensions the relationship between time period (T) and the amplitude (A) can be expressed as


Predict your JEE Main percentile, rank & performance in seconds

Educational materials for JEE preparation

Ask our AI anything

AI can make mistakes. Please verify important information.
AI can make mistakes. Please verify important information.
 91- 6303239042
 Diwali Dhamaka Sale