Join Our JEE Preparation Group
Prep with like-minded aspirants; Get access to free daily tests and study material.
Sign in
Please select an account to continue using cracku.in
↓ →
Join Our JEE Preparation Group
Prep with like-minded aspirants; Get access to free daily tests and study material.
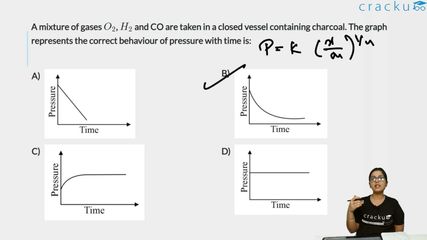
A mixture of gases $$O_2$$, $$H_2$$ and CO are taken in a closed vessel containing charcoal. The graph that represents the correct behaviour of pressure with time is:
Charcoal acts as an excellent adsorbent for gases. When a mixture of gases is enclosed in a vessel with charcoal, the gas molecules accumulate on the solid surface of the charcoal through adsorption.
Option A: Linear Decrease to Zero
This graph shows pressure dropping linearly at a constant rate until it hits zero. This is incorrect because adsorption is a surface phenomenon that slows down as active sites become occupied, and pressure never reaches zero since equilibrium is established.
Option B (Green Checkmark): Exponential Decay to a Constant Value
This graph shows pressure starting high, decreasing rapidly at first (when many charcoal sites are vacant), then curving gradually to level off horizontally. This perfectly depicts the system reaching a state of dynamic equilibrium where pressure remains constant over time.
Option C & D: Increasing or Constant Pressure
These graphs represent pressure either rising or remaining perfectly unchanged from the start, completely ignoring the gas removal caused by the charcoal's adsorption capacity.
The pressure decreases non-linearly with time and eventually levels out horizontally due to the establishment of adsorption equilibrium.
Answer: Option B
Click on the Email ☝️ to Watch the Video Solution
Create a FREE account and get:
_1.webp)

Educational materials for JEE preparation

Ask our AI anything

AI can make mistakes. Please verify important information.
AI can make mistakes. Please verify important information.