Study the graph below and answer the questions that follow:
This graph depicts the last eight years’ annual salaries (in Rs. lacs.) offered to student during campus placement. Every year 100 students go through placement process. However, at least one of them fails to get placed. The salaries of all unplaced students are marked zero and represented in the graph.

The bold line in the graph presents Mean salaries at various years.
In which year were a maximum number of students offered salaries between Rs. 20 to Rs.30 lacs(both inclusive)?
Solution
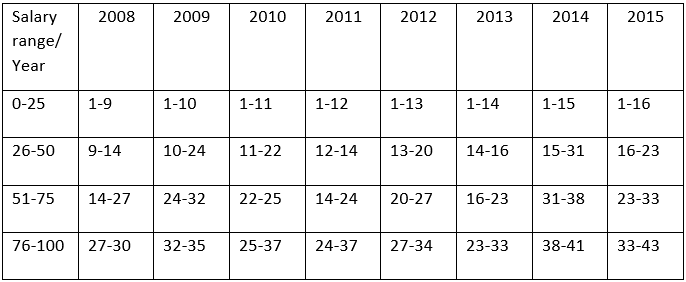
Let's tabulate the information given in the graph,

For a salary range we can get the highest and the lowest value of the range but cannot get the distribution of individual student.
In the year 2008 we have a complete salary range(76-100) inside it and some students of the range 51-75.
In the year 2009 some students of the range 51-75 and some students of the range 75-100.
In the year 2010 some students of the range 51-75 and some students of the range 75-100.
In the year 2012 we have a complete salary range 51-75 inside it and some students of the range (76-100) .
Since we cannot determine the exact students and cannot infer a particular year, Hence answer is E i.e cannot be determined.