Sign in
Please select an account to continue using cracku.in
↓ →
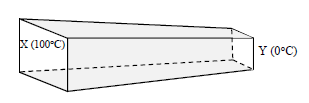
The figure shows a lagged bar XY of non-uniform cross section. One end X of the bar is maintained at $$100^\circ\text{C}$$ and the other end Y at $$0^\circ\text{C}$$. The variation of temperature along its length from X to Y in steady state is best represented by the curve.
_1.webp)

Start your IIM journey with the right preparation and crack CAT 2026.

Educational materials for JEE preparation

Ask our AI anything

AI can make mistakes. Please verify important information.
AI can make mistakes. Please verify important information.
 91- 6303239042