Instructions
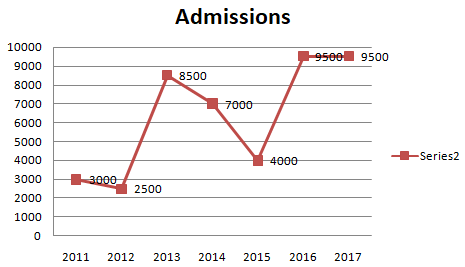
The line graph shows the number of students admitted in the give year to a certain Uniiversity. Study the diagram and answer the following questions.
Year
Solution
Number of more admissions in 2013 than in 2012 = $$8500-2500=6000$$
Number of more admissions in 2016 than in 2015 = $$9500-4000=5500$$
=> In 2013, admissions were greater than that of the previous year.
=> Ans - (A)
Get AI Help
Create a FREE account and get:
- Free SSC Study Material - 18000 Questions
- 230+ SSC previous papers with solutions PDF
- 100+ SSC Online Tests for Free


