DIRECTION for the question: In the following bar graphs given below, one shows the amount (in lakh Rs.) invested by a company in purchasing raw materials over the years and the other shows the value (in lakh Rs.) of finished goods sold by the company over the years. Study the bar graphs and answer the questions based on them
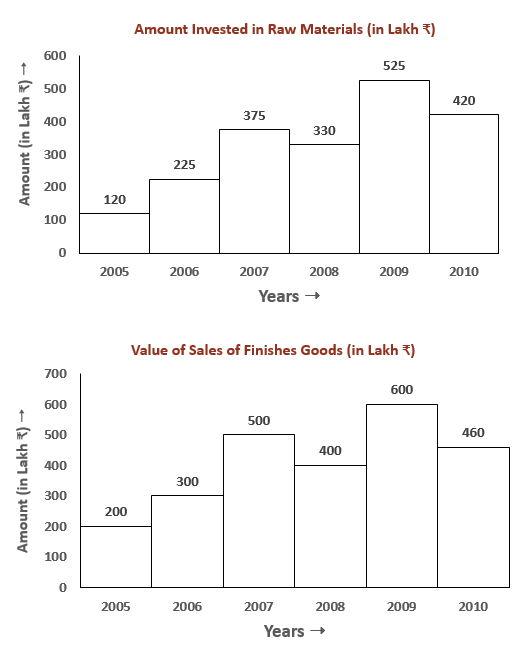
The value of sales of finished goods in 2009 was approximately what percent of the average amount invested in raw materials in the years 2007, 2008 and 2009?
Create a FREE account and get:
- Download Maths Shortcuts PDF
- Get 300+ previous papers with solutions PDF
- 500+ Online Tests for Free

Book Free CAT Mentorship
Get personalized CAT strategy from a 99%iler
500+ students mentored
OTP Verification
Enter the 6-digit code sent to your phone
Booking Summary
Enter OTP
Didn't receive the OTP?


