Instructions
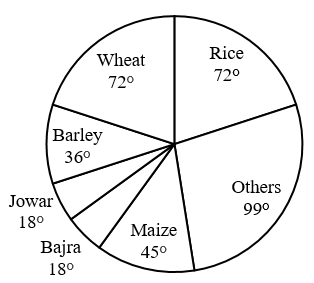
DIRECTIONS for the question: The pie chart shown below gives the distribution of land in a village under various food crops. Study the pie-chart carefully and answer the questions that follow:
Distribution of areas (in acres) under various food crops
Question 147
If the total area goes up by 5%, and the area under wheat production goes up by 12%, then what will be the angle for wheat in the new pie-chart?
Create a FREE account and get:
- Download Maths Shortcuts PDF
- Get 300+ previous papers with solutions PDF
- 500+ Online Tests for Free

Book Free CAT Mentorship
Get personalized CAT strategy from a 99%iler
500+ students mentored
OTP Verification
Enter the 6-digit code sent to your phone
Booking Summary
Session:Free CAT Mentorship
Phone:
Date:
Time:
Enter OTP
Didn't receive the OTP?


