Instructions
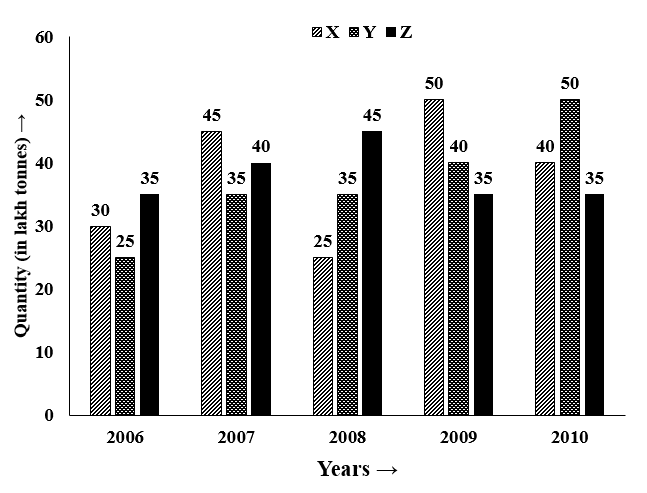
DIRECTIONS for the question:The bar graph given below gives the data of the production of paper (in lakh tonnes) by three different companies X, Y and Z over last 5 years. Study the graph carefully and answer the questions that follow.
Production of paper (in lakh tonnes) by companies X, Y and Z over the years.
Question 142
For which of the following years, the percentage rise or fall in production from the previous year is the maximum for Company Y?
Create a FREE account and get:
- Download Maths Shortcuts PDF
- Get 300+ previous papers with solutions PDF
- 500+ Online Tests for Free

Book Free CAT Mentorship
Get personalized CAT strategy from a 99%iler
500+ students mentored
OTP Verification
Enter the 6-digit code sent to your phone
Booking Summary
Session:Free CAT Mentorship
Phone:
Date:
Time:
Enter OTP
Didn't receive the OTP?


