Question 139
Study the given bar-graph and answer the question that follows.
The bar-graph displays the number of bicycles produced at a factory from 1998 to 2002.
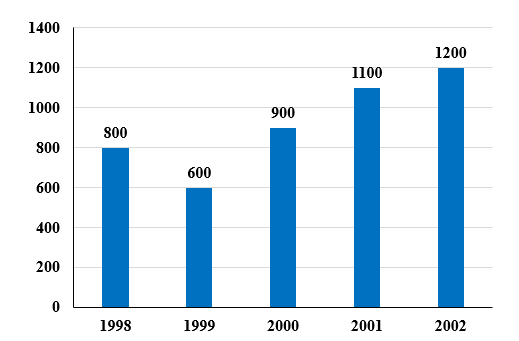
What was the average number of bicycles produced at the factory per year from 1998-2002?
Create a FREE account and get:
- Free SSC Study Material - 18000 Questions
- 230+ SSC previous papers with solutions PDF
- 100+ SSC Online Tests for Free


