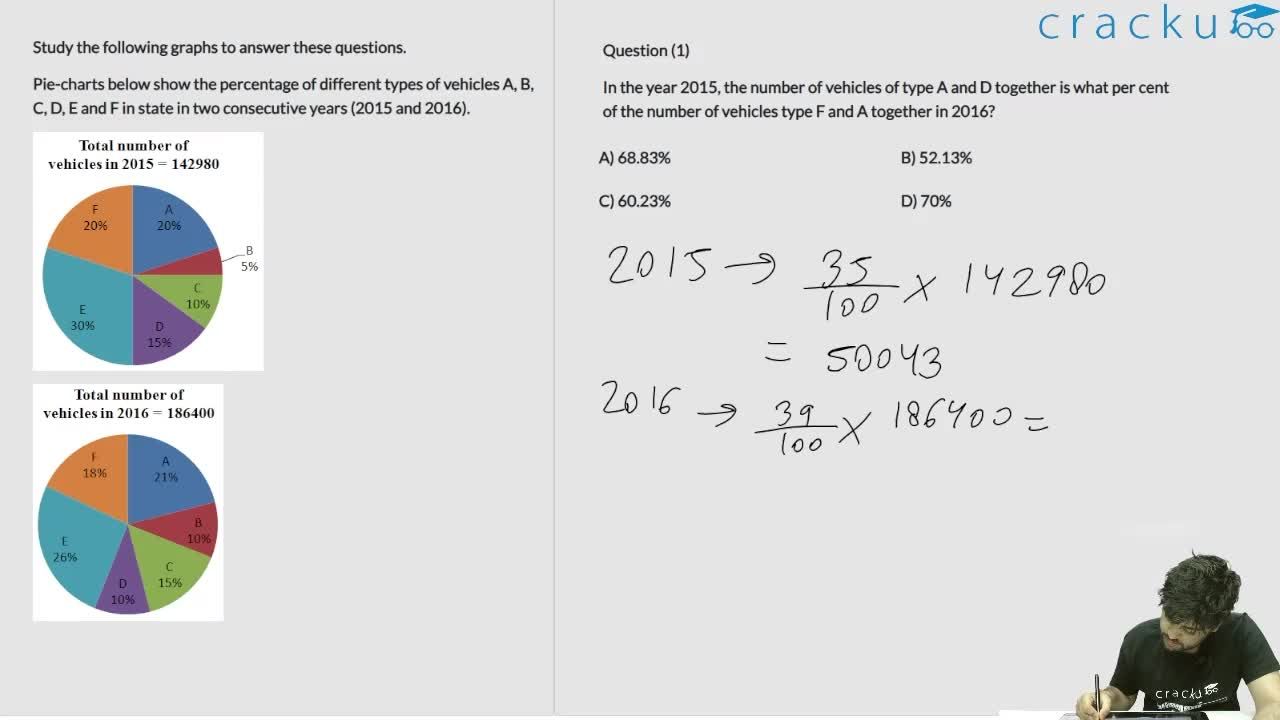
Study the following graphs to answer these questions.
Pie-charts below show the percentage of different types of vehicles A, B, C, D, E and F in state in two consecutive years (2015 and 2016).


If the number of D type of vehicles in 2015 was 5000, what would have been its approximate percentage in the state?
Solution
Option A is the correct answer.
If the number of D-type vehicles in 2015 was 5000, the percentage of them in the state would be:
$$\ \frac{\ 5000}{142980}\times\ 100\ =3.49\%$$
Get AI Help
Video Solution
Click on the Email ☝️ to Watch the Video Solution

SRCC Quant Questions | SRCC Quantitative Ability
SRCC DILR Questions | LRDI Questions For SRCC
SRCC Verbal Ability Questions | VARC Questions For SRCC
Free SRCC DILR Questions
Book Free CAT Mentorship
Get personalized CAT strategy from a 99%iler
500+ students mentored
OTP Verification
Enter the 6-digit code sent to your phone
Booking Summary
Enter OTP
Didn't receive the OTP?


