Answer the questions based on the following graphs
Which of the following year exhibited highest percentage decrease over the preceding year in the automobile production?
Solution
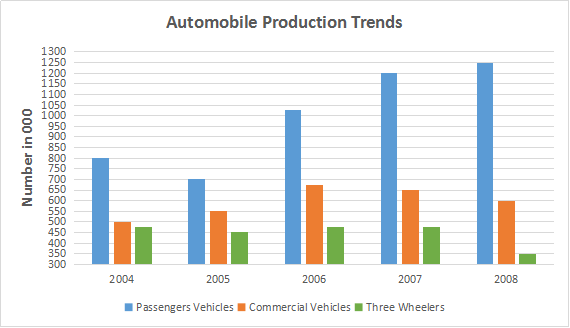
Total automobile production in the year 2004 = 800+500+475 = 1775
Total automobile production in the year 2005 = 700+550+450 = 1700
Total automobile production in the year 2006 = 1025+675+475 = 2175
Total automobile production in the year 2007 = 1200+650+475 = 2325
Total automobile production in the year 2008 = 1250+600+350 = 2200
We can see that production decreased only twice during the given period in the year 2005 and 2008.
Hence, the percentage decrease in the year 2005 over the year 2004 = $$\dfrac{1775-1700}{1775}\times 100$$ = 4.225 percent.
Similarly, the percentage decrease in the year 2008 over the year 2007 = $$\dfrac{2325-2200}{2325}\times 100$$ = 5.376 percent.
Therefore, we can say that option D is the correct answer.
Get AI Help
Video Solution
Click on the Email ☝️ to Watch the Video Solution
Create a FREE account and get:
- All Quant Formulas and shortcuts PDF
- 170+ previous papers with solutions PDF
- Top 5000+ MBA exam Solved Questions for Free

IIFT Quant Questions | IIFT Quantitative Ability
IIFT DILR Questions | LRDI Questions For IIFT
IIFT Verbal Ability Questions | VARC Questions For IIFT
Free IIFT DILR Questions
Book Free CAT Mentorship
Get personalized CAT strategy from a 99%iler
500+ students mentored
OTP Verification
Enter the 6-digit code sent to your phone
Booking Summary
Enter OTP
Didn't receive the OTP?


