Since she believed him to be both candid and trust-worthy, she refused to consider the possibility that his statement had been _________ .
SRCC GBO 2015 Question Paper
Fill in the blank.
Solution
The key to solving this question is understanding the contrast implied by "she refused to consider the possibility that ..." This suggests that the blank should be something that contradicts "candid and trustworthy." Let us inspect the given words based on this understanding -
Option A: This doesn’t directly contradict candor or trustworthiness. Someone can be candid and trustworthy yet say something irrelevant.
Option B: A facetious remark is joking or not meant to be taken seriously, which could contradict "candid" (which implies sincerity). However, this would largely depend on the context. A strong contender but perhaps less apt in this case.
Option C: Being mistaken does not necessarily contradict candidness or trustworthiness. A person can honestly believe something that turns out to be wrong.
Option D: This would fit well in the blank since it directly contradicts the idea conveyed using the words "candid" and "trustworthy."
Hence, Option D is the best choice.
The sheer bulk of data from the mass media seems to overpower us and drive us to ........ accounts for an easily and readily digestible portion of news.
Solution
The statement implies that with so much data and news to go around, we tend to favor a particular type of account for easily digestible portions.
Let's take a look at each option individually:
Option A: insular means narrow-minded, which would not be appropriate given the context of digestible news.
Option B: investigative means an in-depth analysis filled with details, which goes against the idea of digestible news.
Option C: synoptic means providing a summary that best aligns with the given idea. Since there is so much data, we are driven to synoptic accounts that provide summarized versions of this information.
Option D: Subjective here can be eliminated on the same basis as insular since that is not what the sentence is trying to say.
Therefore, Option C is the correct answer.
Any numerical description of the development of the human population cannot avoid .......... simply because there has never been a census of all the people in the world.
Solution
Conjecture means to guess about something without having real proof; this is what the statement means that there cannot be any numerical description of human population without any guess because there has been no census of all people in the world.

Relatively few politicians willingly forsake center stage, although a touch of _____ on their parts now and again might well increase their popularity with the voting public.
Solution
Option C is the correct answer.
Self-effacement is the quality of not claiming attention for oneself.
In this context, it contrasts well with the idea that only a few politicians forsake the centre stage, and a touch of not claiming attention could enhance their popularity.
The other options don't fit the context:
Option A: Garrulity means talkativeness, which wouldn't help with increasing popularity.
Option B: Misanthropy means disliking people, which would likely decrease popularity.
Option D: self-dramatization involves drawing attention to oneself dramatically, which could have the opposite effect of increasing popularity.
Each question has an idiomatic phrase. Choose the word that is closest in meaning to idiomatic phrase.
Wear one's heart on one’s sleeve
Solution
This idiom refers to the feeling of acting passionately, hence A is the correct answer.
See eye to eye
Solution
Option B is the correct answer.
"See eye to eye" means to have the same opinion or to agree on something.
The other options don't have the same meaning:
Option A: Staring at each other means looking at someone intensely, which is not what "see eye to eye" implies.
Option C: "Depend on" means relying or counting on someone, which is different from agreeing or having the same viewpoint.
Option D: Making an effort doesn't mean agreeing with someone.

To fall flat
Solution
The idiomatic phrase "to fall flat" means to fail to generate the intended effect, especially in terms of humour, ideas, or plans. It suggests that something was poorly received or unsuccessful. Only Option D is closest to this meaning, as it aligns with the idea of something failing to impress or engage others.
To stick to one's guns
Solution
Sticking to one's guns means not changing and keeping one's stand when faced with opposition or counterarguments.
Of the given options, A comes closest to capturing the idea of this phrase.
Option B: It's not necessarily suspecting but keeping one's original opinion. Hence, this option can be eliminated.
Option C: This, too, is unrelated to the interpretation of the phrase.
Option D: The phrase does not mean to be satisfied with your own understanding but rather to stand your ground when argued against.
Therefore, option A is the correct answer.
To have the gift of the gab
Solution
To have the gift of the gab means to the ability to speak easily and confidently in a way that makes people want to listen to you and believe you.
Hence, the answer is A talent for speaking.

Talk shop
Solution
Option A is the correct answer.
"Talk shop" is an idiom that refers to discussing work-related topics. So, Option A which says talk about one's profession is the closest meaning.
Option B: "Talk shop" isn't related to shopping.
Option C: "Talk shop" doesn't imply mockery or making fun of something.
Option D: "Talk shop" doesn’t mean to treat something lightly.
Choose the option that replaces the underlined part and makes the sentence most appropriate grammatically.
In addition to providing more course offerings than Modern School, the teachers at Ryan School are better trained than those at Modern, having received more information, on instructing a multilingual and culturally diverse student body.
Solution
The correct answer is "In addition to providing more course offerings than Modern High School, Ryan School has teachers who are better trained than those at Modern, having received more information on instructing a multilingual and culturally diverse student body.
It is modifying teachers. ing modifier for the subject 'teachers'
In 1905, The House of Mirth, Edith Wharton's novel about the blighted aspirations of Lily Bart was published by Scribner's and it was a reputable press in the early twentieth century.
Solution
Here, in the given sentence, the phrase "and it was a reputable press" creates a faulty structure. The sentence seems to suggest that The House of Mirth itself was a reputable press, which is illogical. Instead, Scribner’s (the publisher) is the reputable press, and this must be correctly presented. Thus, we can discard Option A.
Note that a comma is needed before "was published" to properly separate "Lily Bart" from the rest of the sentence. Here, the description of the author and the book is part of a non-essential modifier: "Edith Wharton's novel about the blighted aspirations of Lily Bart." By rule, such modifiers are separated from the main clause using commas.
An easy way to visualise this is to strip down non-essential information to determine the main clause: "In 1905, The House of Mirth was published by Scribner's." The remaining sentence components merely describe the nouns in the main clause. To clarify, the phrase "Edith Wharton's novel about the blighted aspirations of Lily Bart" describes the noun "House of Mirth," and the phrase "a reputable press in the early twentieth century" describes the noun "Scribner's."
Considering these points, we note that only Option D follows this rule and presents a sensible sentence: "In 1905, The House of Mirth, Edith Wharton's novel about the blighted aspirations of Lily Bart, was published by Scribner's, a reputable press in the early twentieth century."
Option B can be eliminated because the correct verb form is "was published." Option C does not adhere to the modifier rule we discussed earlier, and the use of "being" creates an awkward structure.
Hence, Option D is the correct choice.

In the past few months, there has been extensive dispute over if fare hikes should be a first or last recourse in improving the transit system.
Solution
The phrase "over if fare hikes should be a first or last recourse" is incorrect because "if" is not the right conjunction for expressing alternatives in formal writing. Instead, we typically use "whether" in such contexts. This helps us eliminate Options A, B and C and zero in on Option D as the correct choice. In B, the phrase "about if" is ungrammatical. Similarly, in C, the phrase "hiking fares as being" is awkward and unidiomatic.
American executives, unlike their Japanese counterparts, have pressure to show high profits in each quarterly report, with little thought given to long-term goals.
Solution
Let us try to understand what the sentence is trying to convey. The sentence is saying that, unlike their Japanese counterparts, American professionals are expected to perform for each quarterly report.
Now that we have understood this let us try correcting the sentence phrasing. The sentence uses the word pressure to indicate the importance and stress American professionals undergo. The correct construction of this sentence is using the preposition under.
"Under pressure" is the correct idiomatic expression in English to describe someone experiencing stress or urgency to achieve something. "Under pressure" is the standard construction because "pressure" is treated as a force that someone is figuratively beneath, experiencing its effects.
Hence, the correct sentence is American executives, unlike their Japanese counterparts, are under pressure to show profits in each quarterly report, with little thought given to long-term goals.
Choose the order of the sentences marked A, B, C, D and E to form logical paragraph.
A. She got offers to sing from a number of music directors.
B. Consequently, today her name is all over as a popular singer.
C. However, she was really reluctant to give auditions, which delayed her entry into the field music.
D. Not only was she good looking, she had tremendous talent for music, especially singing.
E. When she did start singing, she made a mark for herself in a short time.
Solution
Option C) DCEAB is the correct sequence of sentences to form a logical paragraph:
Sentence D introduces the protagonist, highlighting her appearance and musical talent.
Sentence C, then, reveals her reluctance to audition, which delayed her entry into the music industry. Sentences D and C can be linked, as D mentions her talent while C presents a contrasting statement.
Then, sentence E discusses the next part, indicating that she quickly made a mark for herself once she started singing.
Sentence A follows with her success story, highlighting that she received offers from music directors.
Sentence B concludes by stating that as a result of her achievements in music, she is now widely recognized as a popular singer.

A. As indicated by a number of surveys in 2012, Indian employers will have trouble find in highly qualified people.
B. This has made it a perennial challenge for HR managers in the days to come.
C. India Inc has transformed in to a volatile ground for breeding talent with the amplification of the demand-supply gap.
D. This trend is set to continue for the next three years.
E. This revelation has come as an eye-opener, as in order to run the game here on, the challenge of a talent crunch will be amongst the foremost snags.
Solution
Option c) CBADE forms a logical paragraph
Sentence C introduces the idea that India Inc. is transforming into a difficult place to find talent due to the demand-supply gap.
Sentence B expands on this by mentioning how this will continue to be a challenge for HR managers in the future.
Sentence A provides supporting details about surveys from 2012 that indicate Indian employers will struggle to find highly qualified people.
Sentence D gives a timeline, indicating that this trend will persist for the next three years.
Sentence E concludes with the revelation that this challenge will be significant for companies moving forward.
A Studio journalism with five people discussing the fate of the country is certainly an absurd idea.
B As result, media does not do reflection analysis which is the need of the hour to solve issues.
C Electronic media in our country is obviously Delhi - centred.
D Presently, media is good at highlighting issues but not solving them.
E Thus, you do not have reportage from different parts of the country.
Solution
Given the four options, we see the starting sentence for each.
The sentence certainly cannot start with E hence that is eliminated.
The option showing the order AE does not make sense as E concludes that the new coverage is not from across the country as it should be. It means that the sentence or the context before that should be one introducing the issue.
We see that sentence C does that best by highlighting the Delhi-centred nature of Electronic media.
Hence, the answer is CEADB.
Rearrange the jumbled alphabets in the following four options and find the odd words among them
Solution
Option C is the correct answer.
Option C could be rearranged to get GANGES, the name of a river.
Option A could be rearranged to get VENUS
Option B could be rearranged to get SATURN
Option D could be rearranged to get JUPITER
Options A, B and D could be rearranged to form the names of planets, while option C forms the name of a river. Therefore, it is the odd one out.
Solution
Here, Option B appears to be the odd one out since, on rearranging the letters, we obtain the word GIRAFFE.
The words in Options A, C and D, when examined closely, are BRAZIL, FRANCE, and ISRAEL respectively. These are countries, while the word in Option B mentions an animal.
Solution
Rearranging the characters of the given words, we would get:
(A) TORTOISE
(B) DOLPHIN
(C) PENCIL
(D) SHARK
All the given words except Optin C are animals.
Therefore, Option C is the correct answer.
Each of these questions has a text portion followed by four alternative summaries. Choose the option that best captures the essence of the text.
Social experts point out that people who stay in nuclear families feel more aloof and lonely and are not able to cope with stressful situations of modern life and, in extreme cases, it leads to spontaneous drastic reactions like suicides and even murders.
Solution
The given passage discusses how people living in nuclear families often experience feelings of loneliness and aloofness, making it difficult for them to cope with the stresses of modern life. In extreme cases, this inability to manage stress can lead to drastic actions such as suicides or even murders. Since the statement is presented as an observation by social experts, the ideal summary should reflect their perspective without adding any prescriptive or overly deterministic language. Option C does a good job at this.
Option A is too direct and presents a strong causal relationship by implying that staying in a nuclear family inevitably leads to extreme outcomes, which is not what the original passage suggests. Option D also suffers from an exaggerated cause-and-effect relationship: it suggests that nuclear families directly result in such extreme reactions. On the other hand, Option B seems prescriptive: it advises against nuclear families rather than simply summarizing the given idea.
Hence, Option C is the best summary.
Few would argue that the problem to put an economy as complex as ours on the path of sustained growth is replete with umpteen challenges, but the country has no dearth of able men to lead the nation to prosperity, the moot point being the political will to address core issues involved.
Solution
In the passage, the author acknowledges that achieving sustained economic growth in a complex economy is fraught with challenges. However, he highlights that the country has no shortage of capable individuals who can lead the nation to prosperity. The critical factor, though, is the political will to address the core issues involved in achieving this growth. Option D best captures these components.
Option A, while it mentions challenges and political will, fails to acknowledge the presence of capable individuals, which is a key point in the text. Option B also suffers from the same issue; moreover, it does not touch upon the need for political will. Similarly, Option C fails to mention two of the points: it ignores the challenges and the role of political will, both of which are central to the passage.
India is one of the biggest exporters of knowledge workers, but we do not have the needed mechanism to utilize this asset for our own development and there is a conspicuous absence of local management techniques to enthuse Indian companies to outperform others.
Solution
The passage states the abundance of Indian talent and how the business landscape and ecosystem have failed to use Indian management techniques to exploit it. Option C fits the essence of the passage.
Option D is an overreach by saying, "has not been able to develop management techniques."
Option B is incomplete
Option A has the same problem as D.
Study the passages below and answer the questions that follow each passage?
Passage-I
Of the 197 million square miles making up the surface of the globe, 71 per cent is covered by the interconnecting bodies of marine water; the Pacific Ocean alone covers half the Earth and averages near 14,000 feet in depth. The continents — Eurasia, Africa, North America, South America Australia, and Antarctica — are the portions of the continental masses rising above sea level. The submerged borders of the continental masses are the continental shelves, beyond which lie the deep-sea basins.
The oceans attain their greatest depths not in their central parts, but in certain elongated furrows, or long narrow troughs, called deeps. These profound troughs have a peripheral arrangement, notably around the borders of the Pacific and Indian oceans. The position of the deeps near the continental masses suggests that the deeps, like the highest mountains, are of recent origin, since otherwise they would have been filled with waste from the lands. This suggestion is strengthened by the fact that the deeps are frequently the sites of world-shaking earthquakes. For example, the “tidal wave” that in April, 1946, caused widespread destruction along Pacific coasts resulted from a strong earthquake on the floor of the Aleutian Deep.
The topography of the ocean floors is not well known. Since in great areas, the available soundings are hundreds or even thousands of miles apart. However,the floor of the Atlantic is becoming fairly well known as a result of special surveys since 1920. A broad, well-defined ridge — the Mid-Atlantic ridge — runs north and south between Africa and the two Americas, and numerous other major irregularities diversify the Atlantic floor. Closely spaced soundings show that many parts of the oceanic floors are as tugged as mountainous regions of the continents. Use of the recently perfected method of echo sounding is rapidly enlarging our knowledge of submarine topography. During World War II, great strides were made in mapping submarine surfaces, particularly in many parts of the vast Pacific basin.
The continents stand on the average 2870 feet —slightly more than half a mile — above sea level. North America averages 2300 feet; Europe averages only 1150 feet; and Asia, the highest of the larger continental sub-divisions, averages 3200 feet. The highest point on the globe, Mount Everest in the Himalayas, is 29,000 feet above the sea; and as the greatest known depth in the sea is over 35,000 feet, the maximum relief (that is, the difference in altitude between the lowest and highest points) exceeds 64,000 feet, or exceeds 12 miles. The continental masses and the deep-sea basins are relief features of the first order; the deeps, ridges, and volcanic cones that diversify the sea floor, as well as the plains, plateaus, and mountains of the continents, are relief features of the second Order. The lands are unendingly subject to a complex of activities summarized in the term erosion, which first sculptures them in great detail and then tends to reduce them ultimately to sea level. The modeling of the landscape by weather, running water, and other agents is apparent to the keenly observant eye and causes thinking people to speculate on what must be the final result of the ceaseless wearing down of the lands. Long before, there was a science of geology, Shakespeare wrote “the revolution of the times makes mountains level.”
Which of the following would be the most appropriate title for the passage?
Solution
The passage comprehensively discusses both continental and oceanic features, including deep-sea basins, mountain ranges, continental shelves, and relief features (first and second order). It also addresses geological processes like erosion and tectonic activity. While marine topography (Option B) is a significant focus, the inclusion of continental elevations, erosion, and comparative relief (Mount Everest vs. ocean depths) towards the end broadens the scope to encompass the Earth’s surface as a whole. Thus, Option A seems to be the most suitable title. Options C and D are too narrow or abstract compared to the passage’s descriptive emphasis on physical features.
The "revolution of the times” as used in the passage means the
Solution
Option A is the correct answer.
The phrase 'the revolution of the times' here is used by Shakespeare metaphorically to refer to the passage of time and the ongoing natural processes, such as erosion, that slowly reshape the Earth's surface over time (mountains level) . The idea is that with time, even great mountains will eventually be levelled.
This phrase does not refer to a rebellion, geology specifically, or ocean floor action.
According to the passage, the peripheral furrows or deeps are found
Solution
Option B is the correct answer.
According to the passage, the peripheral furrows or deeps are found near the borders of the Pacific and Indian oceans, and they are often the sites of major earthquakes. The passage mentions Aleutian Deep, where an earthquake in 1946 triggered a tidal wave. So, the deeps are associated with earthquake activity and not any particular ocean locations or the center of the ocean.
Option A: The passage does not claim that these are only found in the Pacific and Indian oceans.
Option C: The passage does not mention that they are found near shores
Option D: The passage says the deeps are present in elongated furrows at the periphery of the oceans and not the centre.
As per the passage,it can be inferred that earthquakes
Solution
The passage suggests that the deeps, which are relatively recent formations, are frequently sites of major earthquakes.
It says: "The position of the deeps near the continental masses suggests that the deeps, like the highest mountains, are of recent origin, since otherwise they would have been filled with waste from the lands."
From this, we can infer that these deep-sea formations, like the highest mountains, are of recent origin, and it is mentioned that earthquakes often occur in these regions. Therefore, we could conclude that earthquakes occur more frequently in newly formed land or sea formations.
Study the passages below and answer the questions that follow each passage?
Passage-II
Plato may have understood better what forms the mind of man than do some of our contemporaries who want their children exposed only to “real” people and everyday events —knew what intellectual experiences make for true humanity. He suggested that the future citizens of his ideal republic begin their literary education with the telling of myths, rather than with mere facts or so-called rational teachings. Even Aristotle, master of pure reason,said: “The friend of wisdom is also a friend of myth.” Modern thinkers who have studied myths and fairy tales from a philosophical or psychological viewpoint arrive at the same conclusion, regardless of their original persuasion. Mircea Eliade, describes these stories as “models for human behavior by that very fact, give meaning and value to life.’ Drawing on anthropological parallels, he and others suggest that myths and fairy tales were derived from, or given symbolic expression to, initiation rites or other rites of passage — such as metaphoric death of an old, inadequate self in order to be reborn on a higher plane of existence. He feels that this is why these tales meet a strongly felt need and are carriers of such deep meaning.
Other investigators with a depth psychological orientation emphasize the similarities between the fantastic events in myths and fairy tales and those in adult dreams and daydreams — the fulfillment of wishes, the winning out over all competitors, the destruction of enemies — and conclude that one attraction of this literature is its expression of that which is normally prevented from coming to
awareness. There are, of course, very significant differences between fairy tales and dreams. For example, in dreams more often than not the wish fulfillment is disguised, while in fairy tales much of it is openly expressed. To a considerable degree, dreams are the result of inner pressures which have found no relief, of problems which beset a person to which he knows no solution and to which the
dream finds none. The fairy tale does the opposite: it projects the relief of all pressures and not only offers ways to solve problems but promises that a “happy” solution will be found. We cannot control what goes on in our dreams. Although our inner censorship influences what we may dream, such control occurs on an unconscious level. The fairy tale, on the other hand, is very much the result of common conscious and unconscious content having been shaped by the conscious mind,not of one particular person, but the consensus of many in regard to what they view as universal human problems, and what they accept as desirable solutions.If all these elements were not present in a fairy tale, it would not be retold by generation after generation. Only if a fairy tale met the conscious and unconscious requirements of many people was repeatedly retold, and listened to with great interest. No dream of a person could arouse such persistent interest unless it was worked into a myth, as was the story of the pharaoh's dream as interpreted by Joseph in the Bible.
It can be inferred from the passage that the author's interestin fairy tales centers chiefly on their
Solution
We look at the following excerpt from the reading comprehension passage,
"The fairy tale, on the other hand, is very much the result of common conscious and unconscious content having been shaped by the conscious mind,not of one particular person, but the consensus of many in regard to what they view as universal human problems, and what they accept as desirable solutions.If all these elements were not present in a fairy tale, it would not be retold by generation after generation. Only if a fairy tale met the conscious and unconscious requirements of many people was repeatedly retold, and listened to with great interest."
We can infer that the author idolises fairy tales due to the fact that they are relevant and psychologically complete, and that is the reason that these tales have been passed on to generations and been retold so many times.
It can be inferred from the passage that Mircea Eliade is most likely a/an
Solution
Let us look at the following excerpt from the passage,
"Mircea Eliade, describes these stories as “models for human behavior by that very fact, give meaning and value to life.’ Drawing on anthropological parallels, he and others suggest that myths and fairy tales were derived from, or given symbolic expression to, initiation rites or other rites of passage — such as metaphoric death of an old, inadequate self in order to be reborn on a higher plane of existence. He feels that this is why these tales meet a strongly felt need and are carriers of such deep meaning."
Mircea Eliade is using fairy tales to make anthropological comparisons to events that are key to life, such as initiation rites or other rites of passage. It can be fairly inferred that he is a student of physical anthropology.
Which of the following best describes the author's attitude toward fairy tales?
Solution
The passage's tone is about open approval towards the psychological and anthropological relevance towards fairy tales.
He starts by stating Plato and Aristotle, comparing them to modern psychologists and philosophers.
The entire passage is about how fairy tales are generationally relevant, hence we can conclude that the tone of the passage is Open Approval.
The author quotes Plato and Aristotleprimarilyin ordert
Solution
The answer is C. The author brings up Aristotle and Plato primarily to support the point of view that Myths are valuable, and their knowledge of life and understanding is much better than that of modern philosophers who dismiss the idea of fairy tales and myths.
From this particular excerpt
"He suggested that the future citizens of his ideal republic begin their literary education with the telling of myths, rather than with mere facts or so-called rational teachings."
We see that he is critical of the so-called rational teaching and quotes Plato to show support for the point of view favouring myths.
The author mentions all of the followingas reasons for reading fairy tales except
Solution
The author compares fairy tales and dreams, states how fairy tales are different from dreams for their psychological and emotional qualities.
We can understand further using the excerpt from the paragraph,
" There are, of course, very significant differences between fairy tales and dreams. For example, in dreams more often than not the wish fulfillment is disguised, while in fairy tales much of it is openly expressed. To a considerable degree, dreams are the result of inner pressures which have found no relief, of problems which beset a person to which he knows no solution and to which the
dream finds none. The fairy tale does the opposite: it projects the relief of all pressures and not only offers ways to solve problems but promises that a “happy” solution will be found. We cannot control what goes on in our dreams. Although our inner censorship influences what we may dream, such control occurs on an unconscious level. The fairy tale, on the other hand, is very much the result of common conscious and unconscious content having been shaped by the conscious mind,not of one particular person, but the consensus of many in regard to what they view as universal human problems, and what they accept as desirable solutions."
The passage states all of the following except subliminal arrgession.
Study the passages below and answer the questions that follow each passage.
Advanced technology has created a vast increase in occupational specialties, many of them requiring many, many years of highly specialised training. It must motivate this training. It has made ever more complex and “rational” the ways in which these occupational specialties are combined in our economic and social life. It must win passivity and obedience to this complex activity. Formerly, technical rationality had been employed only to organise the production of rather simple physical objects, for example, aerial bombs. Now, technical rationality is increasingly employed to organise all of the processes necessary to the utilisation of the physical objects, such as bombing systems, maintenance, intelligence and supply systems. For this reason, it seems a mistake to argue that we are in a “post-industrial” age, a concept favoured by the laissez innover school.
On the contrary, the rapid spread of technical rationality into organisational and economic life and, hence, into social life is more aptly described as second and much more intensive phase of industrial revolution. One might reasonably suspect that it will create analogous social problems. Accordingly, a third major hypothesis would argue that there are very profound social antagonisms or contradictions not less sharp or fundamental than those ascribed by Marx to the development of nineteenth-century industrial society. The general form of the contradictions might be described as follows — a society characterised by the employment of advanced technology requires an ever more socially disciplined population, yet retains an ever-declining capacity to enforce the required discipline.
One way readily describes four specific forms of the same general contradiction. Occupationally, the workforce must be over-trained and under-utilised. Here, again, an analogy to classical industrial practice serves to shorten and simplify the explanation, I have in mind the assembly line. As a device in the organisation of the work process, the assembly line is valuable mainly. It gives management a high degree of control over the pace of the work and, more to the point in the present case, it divides the work process into units so simple that the quality of the work performed is readily predictable. That is, since each operation uses only a small fraction of worker’s skill, there is a very great likelihood that the operation will be performed in a minimally acceptable way. Alternately, if each operation taxed the worker’s skill, there would be frequent errors in the operation, frequent disturbance of the workflow, and a thoroughly unpredictable quality of the end product. The assembly line also introduces standardisation in work skills and thus makes for a high degree of interchange ability among the workforce.
For analogous reasons, the workforce in advanced technological systems must be relatively over-trained or, what is the same thing, its skills relatively under-used. My impression is that this is no less true now of sociologists than of welders, of engineers than of assemblers. The contradiction emerges when we recognize that technological progress requires a continuous increase in the skill levels of its workforce, skill levels which frequently embody a fairly rich scientific and technical training. While at the same time, the advance of technical rationality in work organisation means that those skills will be less and less fully used. Economically, there is a parallel process at work. It is commonly observed that the workforce within technologically advanced organisations is asked to work not less hard but more so. This is particularly true for those with advanced training and skills. Brzezinski's conjecture that technical specialists undergo continuous retraining is off the mark only in that it assumes such retraining only for a managing elite. To get people to work harder requires growing incentives. Yet the prospérity which is assumed in technologically advanced society erodes the value of economic incentives. Salary and wage increases and the goods they purchase lose their overriding importance once necessities, creature comforts, and an ample supply of luxuries are assured. As if in confirmation of this point, it has been pointed out that among young people, one can already observe a radical weakening in the power of such incentives as money, status and authority.
The passage indicates that technologically advanced institutions
Solution
The following sentences appear in the third paragraph and somewhat describe the relationship between advanced technological systems and worker training:
- “For analogous reasons, the workforce in advanced technological systems must be relatively over-trained or, what is the same thing, its skills relatively under-used.”
- “Occupationally, the workforce must be over-trained and under-utilised.”
The excerpt clearly states that workers in such systems are “over-trained” (i.e., trained far beyond the requirements of the tasks they are assigned). The necessity comes from the need to standardise and control work (similar to the assembly line’s division of tasks). Option C best presents this point.
None of the remaining choices are relevant or consistent with the discusssion. Option A is incorrect since the author explicitly contradicts this by stating that skills are “relatively under-used.” The idea is that while workers are over-trained, much of their specialized training is not fully employed in their routine tasks. Option D also presents a contradictory point - the passage indicates that advanced technology “requires an ever more socially disciplined population” but faces challenges in enforcing such discipline. Option B is out of scope - the passage does not address any relationship between technological institutions and democratic systems.
Technologies cannot conquer nature unless
Solution
The passage explains that advanced technology is deeply embedded in how occupations are organised. It argues that effective use of technology depends on the structured training and organisation of a workforce. For example, we are told that {“...the workforce in advanced technological systems must be relatively over-trained or, what is the same thing, its skills relatively under-used.”} And also, the author describes how the assembly line’s division of labour depends on predictable, standardised worker performance. This reflects an institutional control over worker training, mobility, and skills, as suggested in Option D. None of the other points are mentioned or implied in the passage.
It can be inferred from the passage that the author is
Solution
The author critically examines the contradictions inherent in the expansion of technical rationality. Pay heed to the following:
- “For this reason, it seems a mistake to argue that we are in a ‘post-industrial’ age …”
- “... a society characterised by the employment of advanced technology requires an ever more socially disciplined population, yet retains an ever-declining capacity to enforce the required discipline.”
These critiques and the identification of inherent contradictions show a critical and questioning stance toward the functioning of advanced technological institutions. Option D correctly mentions this skeptical attitude.
The author does not praise technological advancement unconditionally (Option A) or advocate for increasing employee control (Option B). The tone is one of critique, pointing out potential problems rather than praising the system. Option C is also not apt - although the author is critical, he does not take a stance of outright opposition to technology; the argument is a bit more nuanced.
The articles states that money, status and authority
Solution
Towards the end of the passage, we are told: {“As if in confirmation of this point, it has been pointed out that among young people, one can already observe a radical weakening in the power of such incentives as money, status and authority.”} Option B can be directly picked out as the correct answer using this excerpt. There is no discussion about any of the other points.
Study the passages below and answer the questions that follow each passage.
One major obstacle in the struggle to lower carbon dioxide emissions, which are believed to play a role in climate change, is the destruction of tropical rainforests. Trees naturally store more carbon dioxide as they age, and the trees of the tropical rainforests in the Amazon, for example, store an average of 500 tons of carbon dioxide per hectare (10,000 square miles). When such trees are harvested, they release their carbon dioxide into the atmosphere. This release of carbon dioxide through the destruction of tropical forests, which experts estimate accounts for 20% of global carbon dioxide emissions annually, traps heat in the earth’s atmosphere, which leads to global warming.
The Kyoto treaty set forth a possible measure to curtail the rate of deforestation. In the treaty, companies that exceed their carbon dioxide emission limits are permitted to buy the right to pollute by funding reforestation projects in tropical rainforests. Since forests absorb carbon dioxide through photosynthesis, planting such forests helps reduce the level of atmospheric carbon dioxide, thus balancing out the companies’ surplus of carbon dioxide emissions. However, attempts at reforestation have so far been unable to keep up with the alarming rate of deforestation, and it has become increasingly clear that further steps must be taken to curtail deforestation and its possible deleterious effects on the global environment.
One possible solution is to offer incentives for governments to protect their forests. While this solution could lead to a drastic reduction in the levels of carbon dioxide, such incentives would need to be tied to some form of verification, which is extremely difficult since most of the world’s tropical forests are in remote areas, like Brazil’s Amazon basin or the island of New Guinea, which makes on-site verification logistically difficult. Furthermore, heavy cloud cover and frequent heavy rain make conventional satellite monitoring difficult.
Recently, scientists at the Japan Aerospace Exploration Agency have suggested that the rates of deforestation could be monitored using new technology to analyze radar waves emitted from a surveillance satellite. By analyzing multiple radar microwaves sent by a satellite, scientists are able to prepare a detailed, high-resolution map of remote tropical forests. Unlike photographic satellite images, radar images can be measured at night and during days of heavy cloud cover and bad weather.
Nevertheless, critics of government incentives argue that radar monitoring has been employed in the past with little success, citing the Global Rain Forest Mapping Project, which was instituted in the mid-1990s amid concern over rapid deforestation in the Amazon. However, the limited data of the Mapping Project was due only to the small amount of data that could be sent from the satellite. Modern satellites can send and receive 10 times more data than their predecessors of the mid-1990s, obviating past problems with radar monitoring. Furthermore, recent technological advances in satellite radar that allow for more accurate measurements to be made, even in remote areas, make such technology a promising step in monitoring and controlling global climate change.
Which one of the following most accurately expresses the main point of the passage?
Solution
The passage begins by explaining the environmental problem: {“One major obstacle in the struggle to lower carbon dioxide emissions... is the destruction of tropical rainforests.”} It describes how trees store carbon dioxide and how deforestation releases it, contributing to global warming. The author goes on to mention efforts such as the Kyoto Treaty, which aimed to address deforestation through reforestation projects. However, he also emphasises the inability of the treaty alone to remedy the issue. It is in this context that the author presents an alternate idea: {“One possible solution is to offer incentives for governments to protect their forests…”} He discusses previous issues with this project, highlighting how “verification” was a limiting factor. Towards the end, the author highlights that advancements in technology can help circumvent this problem: {“Recently, scientists at the Japan Aerospace Exploration Agency have suggested that the rates of deforestation could be monitored using new technology to analyze radar waves emitted from a surveillance satellite.”} This explanation emphasizes that modern radar technology may overcome previous verification difficulties in remote, cloudy areas. This appears to be the core agenda - to showcase how certain modern technologies might aid in the process of forest conservation and help mitigate emissions. Option B, therefore, comes closest to capturing this intent.
Option A is incorrect because the author does not simply state that no good solution exists; he instead highlights the promise of new satellite radar monitoring technology as a potential solution to a major problem. We can also eliminate Option C since the main point is not merely to emphasize the problem but to discuss a promising solution (satellite radar monitoring). Option D mischaracterizes the passage: the focus is not on the companies’ emission reductions but rather on the need for improved monitoring methods to verify and control deforestation effectively through an alternate route.
It can be inferred from the passage that photographic satellite images
Solution
The contrast between radar and photographic imagery is key: {“Unlike photographic satellite images, radar images can be measured at night and during days of heavy cloud cover and bad weather.”} This sentence clearly implies that photographic images have limitations, particularly at night or under poor weather conditions, as suggested in Option B. The remaining choices are neither mentioned nor implied in the discussion.
The information presented in the passage implies which one of the following about the Mapping Project?
Solution
The passage discusses the shortcomings of the Global Rain Forest Mapping Project: {“...critics of government incentives argue that radar monitoring has been employed in the past with little success, citing the Global Rain Forest Mapping Project ... However, the limited data of the Mapping Project was due only to the small amount of data that could be sent from the satellite.”} It then continues: {“Modern satellites can send and receive 10 times more data than their predecessors of the mid-1990s, obviating past problems with radar monitoring.”} Taken together, the passage subtly attributes the project’s limited success to outdated satellite technology that could not transmit sufficient data. Modern satellites, which send 10 times more data, are highlighted as resolving this issue, suggesting in a way that improved data transmission could have enhanced the project’s effectiveness. Option B correctly presents this point.
Option A is a misrepresentation: the failure is attributed not to the use of radar per se but to the technological limitation of data transmission at that time. Option D is also inconsistent with the passage: it is made clear that the Mapping Project used radar monitoring, not conventional photographic satellite monitoring or on-site verification. Option C is new information: there is no connection made in the passage between the Kyoto Treaty and the establishment of the Mapping Project.
According to the passage, each of the following is true about tropical rainforests EXCEPT
Solution
Let us evaluate the choices -
Option A is valid since the passage explains the role of tropical rainforests in carbon dioxide storage and how deforestation releases carbon dioxide: {“Trees naturally store more carbon dioxide as they age... When such trees are harvested, they release their carbon dioxide into the atmosphere.”}
Options B and D are also consistent with the passage: {“...most of the world’s tropical forests are in remote areas, like Brazil’s Amazon basin or the island of New Guinea, which makes on-site verification logistically difficult. Furthermore, heavy cloud cover and frequent heavy rain make conventional satellite monitoring difficult.”}
With regard to the Kyoto Treaty (Option C), the following is stated: {“...companies that exceed their carbon dioxide emission limits are permitted to buy the right to pollute by funding reforestation projects in tropical rainforests.”} However, the treaty does not physically protect the forests from deforestation; it only provides a mechanism to offset emissions.
Hence, Option C is the correct choice.
For the following questions answer them individually
A, B, and C have a few chocolates among themselves. A gives to each of the other two half the number chocolatesthey already have. Similarly, B and C (in that order) gives each of the other two half the number of chocolates each of them already has. Now,ifeach of them has the same number of chocolates, what could be the minimum number of chocolates they have among themselves?
Solution
Let us assume A, B, and C have x with the at the end.
In the last round, chocolates went from C to A and B:
=> A and B will have 2x/3 chocolates and the remaining chocolates will be with C = 5x/3 [why y + y/2 = x => y = 2x/3]
Now, B gives chocolates to A and C
=> A will have 4x/9, C will have 10x/9 => B has 13x/9 chocolates
Now, A gave to B and C
=> B will have 26x/27, C will have 20x/27, A will have 7x/27
=> For this to be integer x = 27 => Total chocolates with them = 27 * 3 = 81.
ABC is an equilateral triangle while PQRS is a rectangle, then what is the area of PQRS if each side of the $$\triangle$$ABC = 10. The side of the rectangle passes through the center O of the circle?

Solution
The centre of the circle would act as the centroid of the triangle, from where all the median shall pass.
The length of the median is $$\ \frac{\ \sqrt{\ 3}}{2}\times\ 10$$, which is $$5\sqrt{\ 3}$$ cm.
Now, this median shall be divided in 2:1 by the centroid (centre of the circle), and hence the smaller part which is the radius of that circle becomes $$\ \frac{\ 5}{\sqrt{\ 3}}$$cm (the breadth of the rectangle).
Double of this shall be length of the triangle, which is $$\ \frac{\ 10}{\sqrt{\ 3}}$$cm.
Hence, the area of the traingle is $$\ \ \frac{\ 50}{3}$$cm, or 16.67 cm.
Five bells begin to toll together and toll respectively at intervals of 6, 7, 8, 9 and 12 seconds. How many timesthey will toll together in one hour?
Solution
L.C.M. of (6,7,8,9,12) = 504
Thus, after every 504 seconds = 8.4 minutes, the bells toll together.
=> Number of times, they will toll together in an hour = $$\frac{60}{8.4}=7.14=$$ 7 times
=> Ans - (D)
Eight members of different ages from the same family sit around a circular table for dinner. In how many ways can they be arranged such that on either side of younger members there are elder members seated?
Solution
From the question, we should arrange younger and older people in an alternate manner.
First, we should arrange the 4 elder people in a circular arrangement in (4 - 1)! = 6 ways.
Now, for the 4 younger people, this is similar to a linear arrangement, as the gaps are distinct positions = 4! = 24 ways.
=> Required number of total arrangements = 6 * 24 = 144 ways.
The median ofthe first 20 prime numbers is
Solution
First 20 prime numbers = 2, 3, 5, 7, 11, 13, 17, 19, 23, 29, 31, 37, 41, 43, 47, 53, 59, 61, 67, 71
Thus, median is mean of 10th and 11th value = $$\frac{(29+31)}{2}$$
= $$\frac{60}{2}=30$$
=> Ans - (D)
Sum of two numbers is 17, whereas sum of their squares is 145. What is the product of the two numbers?
Solution
Let the two numbers be $$x$$ and $$y$$
=> Sum = $$x+y=17$$
Squaring both sides, we get : $$(x+y)^2=(17)^2$$
=> $$x^2+y^2+2xy=289$$
Also, it is given that $$x^2+y^2=145$$
=> $$2xy=289-145=144$$
=> $$xy=\frac{144}{2}=72$$
=> Ans - (A)
What is the least square number which is divisible by 3, 5, 6 and 9?
Solution
L.C.M. of (3,5,6,9) = 90
Now, the numbers of the form $$90k$$ will be divisible by 3,5,6,9, where $$k$$ is a natural number
Prime Factorization of 90 = $$3^2\times2\times5$$
Thus, in order to have both even powers, we need to multiply it by 10 = 900
=> Ans - (A)
If $$\left(1 + \frac{x}{144}\right)^{\frac{1}{2}} = 1 + \frac{1}{2}$$, what is the value of x?
Solution
Expression : $$\left(1 + \frac{x}{144}\right)^{\frac{1}{2}} = 1 + \frac{1}{2}$$
=> $$1+\frac{x}{144}=(\frac{3}{2})^2$$
=> $$\frac{x}{144}=\frac{9}{4}-1$$
=> $$x=\frac{5}{4}\times144=180$$
The difference between two positive numbers is 3. If the sum of their squares in 369, then the sum of the numbers is
Solution
Let the numbers be $$x$$ and $$y$$
Given : $$(x-y)=3$$ -----------(i) and $$x^2+y^2=369$$ ------------(ii)
Squaring both sides in equation (i), we get : $$x^2+y^2-2xy=9$$
Substituting value from equation (ii), => $$2xy=369-9=360$$
=> $$xy=\frac{360}{2}=180$$
To find : $$(x+y)=z=?$$
Now, we know that $$(x+y)^2=x^2+y^2+2xy$$
=> $$z^2=369+2(180)=729$$
=> $$z=\sqrt{729}=27$$
=> Ans - (C)
If $$x = 7 - 4 \sqrt{3}$$, then the value of $$x^2 + \frac{1}{x^2}$$ is
Solution
Given : $$x = 7 - 4 \sqrt{3}$$ ------------(i)
=> $$\frac{1}{x}=\frac{1}{7-4\sqrt3}$$
Rationalizing the denominator, we get
=> $$\frac{1}{x}=\frac{1}{7-4\sqrt3}\times(\frac{7+4\sqrt3}{7+4\sqrt3})$$
=> $$\frac{1}{x}=\frac{(7+4\sqrt3)}{(7)^2-(4\sqrt3)^2}$$
=> $$\frac{1}{x}=\frac{7+4\sqrt3}{49-48}=7+4\sqrt3$$ ------------(ii)
Adding equations (i) and (ii), we get : $$(x+\frac{1}{x})=14$$
Squaring both sides, $$(x+\frac{1}{x})^2=(14)^2$$
=> $$x^2+\frac{1}{x^2}+2(x)(\frac{1}{x})=196$$
=> $$x^2+\frac{1}{x^2}=196-2=194$$
=> Ans - (D)
If one-third of one-fourth of a number is 15, then three-tenth of that number is
Solution
Given : one-third of one-fourth of a number is 15
=> Number = $$15\times3\times4=180$$
$$\therefore$$ $$\frac{3}{10}\times180=54$$
=> Ans - (D)
What least fraction must be subtracted from the square root of $$105\frac{1}{16}$$ so that the result is a whole number?
Solution
Square root of : $$\sqrt{105\frac{1}{16}}$$
= $$\sqrt{\frac{1681}{16}}=\frac{41}{4}=10\frac{1}{4}$$
Now, the least number to be divided to make it a whole number is clearly $$\frac{1}{4}$$
= $$10+\frac{1}{4}-\frac{1}{4}=10$$
=> Ans - (A)
Which one of the following fractions is the least?
$$\frac{29}{57}, \frac{31}{85}, \frac{13}{38}, \frac{17}{42}$$
Solution
$$\frac{29}{57}\approx0.5$$
$$\frac{31}{85}\approx0.36$$
$$\frac{13}{38}\approx0.33$$ [LEAST]
$$\frac{17}{42}\approx0.5$$
=> Ans - (C)
The sum and product of two numbers are 12 and 35 respectively. What will be the sum of their reciprocals?
Solution
Let the two numbers be $$x$$ and $$y$$
Given : $$x+y=12$$ and $$xy=35$$ ------------(i)
To find : $$\frac{1}{x}+\frac{1}{y}$$
= $$\frac{x+y}{xy}$$
Using equation (i), = $$\frac{12}{35}$$
=> Ans - (C)
The simplified value of $$\frac{\frac{1}{3} + \frac{1}{3} \times \frac{1}{3}}{\frac{1}{3} + \frac{1}{3} of \frac{1}{3}} - \frac{1}{9}$$ is
Solution
Expression : $$\frac{\frac{1}{3} + \frac{1}{3} \times \frac{1}{3}}{\frac{1}{3} + \frac{1}{3} of \frac{1}{3}} - \frac{1}{9}$$
= $$\frac{\frac{1}{3} + \frac{1}{9}}{\frac{1}{3} + \frac{1}{9}} - \frac{1}{9}$$
= $$1-\frac{1}{9}=\frac{8}{9}$$
=> Ans - (D)
.Two numbers are such that they are 40% and 50% of the third number. First number as a percentage of the secondis
Solution
Let third number be 10
Thus, first number = 4 and second number = 5
=> Required % = $$\frac{4}{5}\times100=80\%$$
=> Ans - (A)
A student has to secure 45% marks to qualify for interview in a written examination. If he gets 79 marks and fails by 56 marks, what is the maximum marks setto qualify for
Solution
Let total marks = $$100x$$ and minimum marks to qualify is 45% = $$45x$$
According to ques, => $$45x=79+56$$
=> $$45x=135$$
=> $$x=\frac{135}{45}=3$$
$$\therefore$$ Max marks = 300
=> Ans - (B)
Anita gave 10% in charity from her salary, and then 20% from the remaining she gave to her friend as loan. She is left now with ₹7200. What is the salary of Anita?
Solution
Effective % amount she gave to charity and friend = $$10+20-(\frac{10\times20}{100})=28\%$$
Now, remaining salary is $$72\%\equiv7200$$
=> Total salary = $$100\%\equiv\frac{7200}{72}\times100=Rs.$$ $$10,000$$
=> Ans - (B)
A man gets double the amount in 7 years at a certain rate percent. In how many years, he gets 8 the amount at the same rate?
Solution
Using the formula : $$\frac{N_1-1}{N_2-1}=\frac{T_1}{T_2}$$
Let in $$t$$ years, he gets 8 times the amount.
=> $$\frac{2-1}{8-1}=\frac{7}{t}$$
=> $$\frac{1}{7}=\frac{7}{t}$$
=> $$t=49$$ years
=> Ans - (B)
A Man took a loan of ₹ 2400 to be paid back in 13 equal monthly installments of ₹ 200 each.If the rate of interest is simple, what is the rate percent?
Solution
Let rate of interest = $$r\%$$ and principal sum = Rs. 2400
Simple interest for 13 months = $$\frac{P\times R\times T}{100}$$
=> $$\frac{2400\times r\times13}{12\times100}=200$$
=> $$26r=200$$
=> $$r=\frac{100}{13}\approx7.7\%$$
=> Ans - (D)
Rani invested a sum of ₹800 in a post office for 3 years at 5% compound interest, How much will she get at the end of 3 years
Solution
Principal sum = Rs. 800
Rate of interest = 5% for 3 years
Amount under compound interest = $$P(1+\frac{r}{100})^T$$
= $$800\times(1+\frac{5}{100})^3$$
= $$800\times(\frac{21}{20})^3$$
= $$\frac{9261}{10}=Rs.$$ $$926.10$$
=> Ans - (C)
On what principal will the compound interest for 3 years at 5% per annum amount to ₹63.05?
Solution
Let principal amount be Rs. $$P$$
Rate of interest = 5% for 3 years
Compound interest = $$P[(1+\frac{R}{100})^T-1]$$
=> $$P[(1+\frac{5}{100})^3-1]=63.05$$
=> $$P[(\frac{21}{20})^3-1]=63.05$$
=> $$P\times(\frac{9261-8000}{8000})=63.05$$
=> $$P=63.05\times\frac{8000}{1261}=Rs.$$ $$400$$
=> Ans - (A)
A is thrice as good a workman as B and therefore able to finish a piece of work in 60 days less than B. How much time will they both take to finish it together
Solution
Let time taken by B = $$t$$ days, and thus time taken by A = $$(t-60)$$ days
Since, efficiency is inversely proportional to time,
=> $$\frac{3}{1}=\frac{t}{t-60}$$
=> $$3t-180=t$$
=> $$2t=180$$
=> $$t=\frac{180}{2}=90$$
Thus, time taken by B is 90 days and by A is 30 days
=> Time taken by them to finish the work together = $$1\div(\frac{1}{90}+\frac{1}{30})$$
= $$\frac{90}{4}=22\frac{1}{2}$$ days
=> Ans - (B)
A does half as much work as B, and C does half as much work as A and B together. If C alone can finish the work in 40 days then together all will finish the work in?
Solution
Let B's efficiency = $$4x$$ units/days
=> A's efficiency = $$2x$$ units/day
=> C's efficiency = $$3x$$ units/day
If C alone can finish the work in 40 days, => Total work = $$120x$$ units
Time taken for all of them to finish the work together = $$\frac{120x}{(4x+2x+3x)}$$
= $$\frac{120}{9}=13\frac{1}{3}$$ days
=> Ans - (A)
A train 110 m in length is travelling at the speed of 58 km/h. The time taken in which it will pass a passer by walking at the rate of 4 km/h in the same direction is
Solution
Speed of train = 58 km/hr and speed of passer by = 4 km/hr
Relative speed = $$58-4=54$$ km/hr = $$54\times(\frac{5}{18})=15$$ m/s
=> Time taken to cross the passer by = $$\frac{110}{15}=7\frac{1}{3}$$ seconds
=> Ans - (C)
A car can finish a certain journey in 10 hours at a speed of 48 km/h. In order to cover the same distance in 8 hours, the speed of the car must be increased by
Solution
Distance covered by car in 10 hours at 48 km/hr
= $$10\times48=480$$ km
Now, speed when it is covered in 8 hours = $$\frac{480}{8}=60$$ km/hr
Thus, speed must be increased by = $$60-48=12$$ km/hr
=> Ans - (C)
In covering a certain distance, the speeds of A and B are in the ratio of 3: 4. A takes 20 minutes more than B to reach the destination. The time taken by A to reach the destination is
Solution
Let time taken by B is $$t$$ minutes, and thus time taken by A = $$(t+20)$$ minutes
Also, speed is inversely proportional to time,
=> $$\frac{3}{4}=\frac{t}{t+20}$$
=> $$3t+60=4t$$
=> $$t=60$$
Thus, time taken by A = $$60+20=80$$ minutes = $$1\frac{1}{3}$$ hours
=> Ans - (B)
A man walks to a place at 8 km/h and returns from that place at 6 km/hr. If the total time taken by him is $$3\frac{1}{2}$$ hours, the total distance he walks is
Solution
Let distance each side be $$d$$ km
Using, time = distance/speed
=> $$\frac{d}{8}+\frac{d}{6}=3.5$$
=> $$\frac{7d}{24}=\frac{7}{2}$$
=> $$d=12$$ km
Thus, total distance travelled (both sides) = $$12\times2=24$$ km
=> Ans - (C)
The ratio of age of Aman and his mother is 3:11 . the difference of their ages is 24 years. what will be the ratios of their ages after 3 years?
Solution
Let Aman's age = $$3x$$ years and his mother's age = $$11x$$ years
=> Difference = $$11x-3x=8x=24$$
=> $$x=3$$
$$\therefore$$ Ratio after 3 years = $$\frac{3(3)+3}{11(3)+3}$$
= $$\frac{12}{36}=1:3$$
=> Ans - (A)
A, B and C have amounts in the ratio of 3 : 4 : 5. First B gives $$\frac{1}{4^{th}}$$ to A and $$\frac{1}{4^{th}}$$ to C then C gives $$\frac{1}{6^{th}}$$ to A. What is the final ratio of amount of A, B and C respectively?
Solution
Let amount with A, B and C be Rs. $$300,400,500$$ respectively.
First, B gives $$\frac{1}{4^{th}}$$ to A and $$\frac{1}{4^{th}}$$ to C
=> Amount with A = $$300+\frac{1}{4}\times400=Rs.$$ $$400$$
C = $$500+\frac{1}{4}\times400=Rs.$$ $$600$$
B = $$400-100-100=Rs.$$ $$200$$
Secondly, C gives $$\frac{1}{6^{th}}$$ to A
=> Amount with A = $$400+\frac{1}{6}\times600=Rs.$$ $$500$$
B = $$Rs.$$ $$200$$
C = $$600-100=Rs.$$ $$500$$
Thus, final ratio with A:B:C = 5:2:5
=> Ans - (D)
Ms. Gupta bought a house for ₹C in 2010. Three years later she sold the house for 25% more than she paid for it. She has to pay a tax of 50% on the gain. (The gain is the selling price minus the cost.) How much tax must Ms. Gupta pay?
Solution
Cost price of house = Rs. $$C$$
Profit on house = $$\frac{25}{100}\times C=Rs.$$ $$\frac{C}{4}$$
Tax paid = $$\frac{50}{100}\times\frac{C}{4}=Rs.$$ $$\frac{C}{8}$$
=> Ans - (C)
What is the area of the figure below, if ABDC is a rectangle and BDE is an isosceles right triangle ?

Solution
Area of figure = area (ABCD) + area (BDE)
= $$(ab)+(\frac{1}{2}\times b\times b)$$
= $$b(a+\frac{b}{2})$$
=> Ans - (C)
If $$2x + y= 5$$, then $$4x + 2y =$$
Solution
Given : $$2x + y= 5$$ -------------(i)
Multiplying equation (i) by 2, we get :
=> $$4x+2y=10$$
=> Ans - (D)
If the radius of a circle is increased by 6%,then the area of the circle is increased by
Solution
Let radius of circle be $$r=1$$ units
=> Area = $$\pi r^2=\pi$$ sq.units
Now, after 6% increase, new radius = $$r'=1.06$$ units
=> New area = $$\pi(r')^2=1.1236\pi$$ sq. units
$$\therefore$$ Increase in area = $$\frac{1.1236-1}{1}\times100=12.36\%$$
=> Ans - (D)
If a light flashes every 6 seconds, how many times will it flash in $$\frac{3}{4}$$ of an hour?
Solution
Number of time light flashes in 6 seconds = 1 time
Number of times it will flash in 45 minutes (or 2700 sec) = $$\frac{2700}{6}=450$$
=> Ans - (C)
The sum and difference of LCM and HCF of 2 numbers is 638 and 580. The sum of two numbers is 290. What are the two numbers?
Solution
Let the L.C.M. and H.C.F. of the two numbers be $$x$$ and $$y$$
According to ques, => $$x+y=638$$
and $$x-y=580$$
Adding above equations, we get : $$x=609$$ and $$y=29$$
Thus, H.C.F. = 29 and L.C.M. = 609
Let the two numbers be $$29a$$ and $$29b$$, where $$a$$ and $$b$$ are co-prime
=> Sum of numbers = $$29a+29b=290$$
=> $$a+b=10$$
Since, they are co-prime, possible values of $$(a,b)$$ are : (1,9), (3,7)
Now, to get L.C.M. as 609, we have $$a=3$$ and $$b=7$$ (or vice-versa)
Thus, the numbers are : 87 and 203
=> Ans - (B)
In a two-digit number, the unit digit is 3 more than the ten's digit. The difference between the number and the number formed by interchanging the digits of the number is 27. What is the value of original number?
Solution
Let the ten's digit be $$x$$ and unit's digit = $$x+3$$
Thus, number = $$10x+(x+3)=11x+3$$
If we interchange the digits, number = $$10(x+3)+x=11x+30$$
=> Difference = $$(11x+30)-(11x+3)=27$$
Since, the difference is always constant, hence we cannot find the two-digit number, it can be 14,25,36,47,58,69
=> Ans - (D)
A washing machine was purchased under installment system, cash down payment is ₹ 3,000 and 3 equal annual installments of ₹1,300 are payable at the end of first, second and third year. If rate of interest is 10% p.a. under simple interest. Find the price of washing machine and the total interest charged under installment plan.
Solution
Let the price of washing machine = Rs. $$100x$$
Rate of interest is 10% for 3 years under simple interest
=> S.I. = $$\frac{P\times R\times T}{100}$$
Total amount paid = $$3000+(3\times1300)=Rs.$$ $$6900$$
=> $$100x+\frac{(100x-3000)\times10\times3}{100}=6900$$
=> $$100x+(x-30)\times30=6900$$
=> $$130x-900=6900$$
=> $$130x=6900+900=7800$$
=> $$x=\frac{7800}{130}=60$$
$$\therefore$$ Sum = Rs. 6,000$$ and thus total interest charged = Rs. 900
=> Ans - (D)
The three sides of a right-angled triangle have integral lengths and also form an arithmetic progression. A possible length of one of the sides is
Solution
Let the three sides be $$(a-d),a,(a+d)$$ units
In a right angled triangle,
=> $$(a-d)^2+(a)^2=(a+d)^2$$
=> $$2a^2+d^2-2ad=a^2+d^2+2ad$$
=> $$a^2=4ad$$
=> $$a=4d$$
Thus, the three sides are : $$3d,4d,5d$$
Thus, the sides are multiples of either 3,4 or 5. Thus, only possible side among the options is 56.
=> Ans - (D)
Mona and Sonastart simultaneously from two towns, P and Q, towards Q and P respectively at 8:00 AM.R is a checkpost which is midway between P and Q. Both Mona and Sona turn back towards their respective starting points whenever they reach R and every time-they reach their starting points they turn back andreturn to R. If the speeds of Mona and Sonaare 45 km/h and60 km/h respectively and PQ = 24 km, when will they reach R at the same time?
Solution
To reach R at the same moment for the first time, Sona has to gain one entire trip (Q-R, R-Q,Q-R) which is 36 km, over Mona.
Hence, the difference between distances covered by Mona and Sona in time T shall be 36 km.
This means, 60T - 45T = 36,
or T = 144 min, which is 10:24 am.
Consider the following graph and answer the questions based on it.

At what ages are the requirements of calories for baby boys and baby girls equal?
Solution
At 2 months of age, both baby boys and baby girls require 1200 calories per day.
Similarly, at 8 months of age, both baby boys and baby girls require 1500 calories per day.
Hence, the answer is 2 months and 8 months.
The difference between the calorie requirement for baby boys and baby girls at the age of 6 months is approximately equal to
Solution
At the age of 6 months, a baby boy requires 1700 calories and a baby girl requires 1400 calories.
So, the difference is 300 calories.
If in a family there are four baby boys aged 4, 6, 8 and 12 months respectively, and three baby girls aged 2, 8 and 16 months respectively, then what is the total calorie requirement per day for the babies in the family?
Solution
The calorie requirement per day for the four baby boys aged 4, 6, 8 and 12 months is 1400, 1700, 1500 and 3000, respectively.
Similarly, the calorie requirement per day for the three baby girls aged 2, 8 and 16 months is 1200, 1500 and 2000, respectively.
Hence, the total calorie requirement is 1400+1700+1500+3000+1200+1500+2000 = 12300
So, the answer is none of these.
In the previous question, if the baby girl aged 16 months goes away, what is the percentage change in the calorie requirement per month for the family?
Solution
In the previous question, we got the total calorie requirement as 1400+1700+1500+3000+1200+1500+2000 = 12300.
Now, if the baby girl aged 16 months is not there, there will be a reduction of the 2000 calorie requirement.
So, in percentage terms $$\dfrac{2000}{12300}\times100=16.3\%$$
Hence, the answer is 16.3%
In a family there are four baby boys aged 4, 6, 8 and 12 months respectively, and three baby girls aged 2, 8 and 16 months respectively. However, doctor Raj informs Ravi that the graphs have got mixed up and what is shown for the baby boys, is for the baby girls and vice versa, then what is the total calorie requirement per day for the babies in the family?
Solution
The calorie requirement per day for the four baby boys aged 4, 6, 8 and 12 months is 1100, 1400, 1500 and 2300, respectively.
Similarly, the calorie requirement per day for the three baby girls aged 2, 8 and 16 months is 1200, 1500 and 3500, respectively.
Hence, the total calorie requirement is 1100+1400+1500+2300+1200+1500+3500 = 12500
So, the answer is none of these.
The following pie charts give the information about the distribution of weight in the human body according to different kinds of components. Study the pie charts carefully to answer these questions.


How much of the human body is neither made of bones nor skin?
Solution
We are given in the first graph that skin is $$\dfrac{1}{10}$$, bones is $$\dfrac{1}{5}$$, muscles is $$\dfrac{3}{10}$$ and the rest is others.
The total sum must be equal to 1.
Skin + Bones + Muscles + others = 1
Others = 1 - Skin - Bones - Muscles
Others $$=\ 1\ -\ \dfrac{1}{10}\ -\ \dfrac{1}{5}\ -\ \dfrac{3}{10}\ =\ \dfrac{10\ -\ 1\ -\ 2\ -\ 3}{10}\ =\ \dfrac{4}{10}$$
Neither bones nor skin = Muscles + others = $$\ \dfrac{3}{10}\ +\ \dfrac{4}{10}\ =\ \dfrac{7}{10}\ =\ \dfrac{7}{10}\ \times\ 100\ =\ 70\%$$
Hence, the correct answer is option D.
What is the ratio of the distribution of proteins in the muscles to that of the distribution of proteins in the bones?
Solution
We can say that the protein content will be proportionately distributed according to the weight of the muscles and bones.
Muscles are 3/10 of the body weight
Bones are 1/5 of the body weight
The required ratio will be, $$\dfrac{\dfrac{3}{10}}{\dfrac{1}{5}}=\dfrac{3}{2}$$
What percentage of proteins of the human body is equivalent to the weight of its skin?
Solution
Let the weight of body be 100x Kg
So, Weight of protein=24x Kg
Weight of skin=$$\dfrac{1}{10}\times\ 100x$$ = 10x Kg
Let required percentage be 'k'
24x*$$\dfrac{k}{100}$$ = 10x
k=$$\dfrac{125}{3}$$=41.66%
Option A is the correct answer.
Mr Kunal Sharma wants to buy a motorbike which is priced at ₹45,500. The bike is also available at ₹25,000 down payment and monthly installments of ₹1000 per month for 2 years or ₹18,000 down payment and monthly installment of ₹1000 per month for 3 years. Mr Kunal has with him only ₹12,000. He wants to borrow the balance money of the down payment from a private lender whose terms are : if ₹6,000 is borrowed for 12 months, the rate of interest is 20%. The interest will be calculated on the whole amountfor the whole year, even though the repayment has to be done in 12 equal monthly installments starting from the first month itself. Thus he will have to repay an amount of ₹600 per month for 12 months to repay ₹6000 (Principal) + ₹1200 (Interest @ 20%). If ₹10,000 upwards is borrowed for one year, the rate of interest is 30% and is calculated in exactly the same manner as above.
If Mr Kunal is ready to pay either of the down payments then which of the installment schemes is the better option of the two? (Assume that Mr Kunal will pay the installments out of his own earnings and he keeps his savings with himself and earns no interest on the same.) Also assume that instead of borrowing the remaining money for the down payment, he saves the balance before the purchase
Solution
In the question it is told that Mr Kunal is ready to pay either of the down payments. And it is also said that he earns no interest on the income.
So, the scheme that has less installment cost will be the better option.
In case of scheme 1, he will pay monthly installments of ₹1000 per month for 2 years. That makes 12,000*2 = Rs. 24,000
In case of scheme 2, he will pay monthly installments of ₹1000 per month for 3 years. That makes 12,000*3 = Rs. 36,000
So, down payment of Rs. 25,000 is better option.
What is the percentage difference in the total amount paid to the bike dealer between the two installment schemes (with respect to the total payment of the scheme with ₹25,000 down payment)?
Solution
Let us calculate the total amount paid to the bike dealer for the two installment schemes.
Scheme 1: ₹25,000 down payment and monthly installments of ₹1000 per month for 2 years.
Cost incurred through this is Rs. 25,000+1000*24 = 25,000+24,000 = Rs. 49,000
Scheme 2: ₹18,000 down payment and monthly installment of ₹1000 per month for 3 years
Cost incurred through this is Rs. 18,000+1000*36 = 18,000+36,000 = Rs. 54,000
The difference between the two is Rs. 5,000
5,000 as a percentage of 49,000 will be $$\frac{5000}{49000}\cdot100=$$ 10.2%
If Kunal can spare only a total of ₹2000 to be paid to the bike dealer and the money lender from his monthly earnings starting from the first month onwards, which scheme should be chosen?
Solution
He can only spend 2000 for each month. In both the schemes he has to pay 1,000 to the dealer.
In he goes with the first scheme, his monthly payment to the lender will be $$\frac{\left(1.3\cdot(25000-12000)\right)}{12}\ =\frac{1.3\cdot13000}{12}=\frac{16900}{12}=1408.33$$.
He has to pay 1408.33+1000 = 2408.33 every month. But this is more than 2000. So, this is not feasible for him.
In he goes with the second scheme, his monthly payment to the lender will be $$\frac{\left(1.2\cdot6000\right)}{12}\ =\frac{7200}{12}=600$$
He has to pay 1000+600 = 1600 every month through the second scheme.
So, answer is 1000 for 3 years.
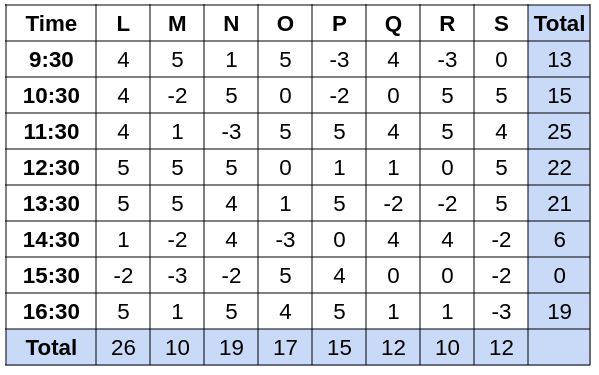
The following table is based on the work record of 8 workers — L, M, N, O, P, Q, R and S who are working under the supervision of Gopinath on the $$30^{th}$$ September.

A = Talking informally
B = Working sincerely
C = Pretending to work
D = Sitting idle
E = Discussing about work
F = Not at work place
G = Disturbing others

The management allocated points for the workers as follows :
A = -2 : B = 5; C = 1 ; D = 0; E = 4; F = -3; G = 4
The person, who got the highest points for his work on September 30, is
Solution
Let us fill in the points received by each worker by management at each time.
We know A = -2 : B = 5; C = 1 ; D = 0; E = 4; F = -3; G = 4
Take the total points received by each worker on 30th September and the total points received by all workers combined at a particular time.
The person who got the highest points for his work on September 30 among N,R,Q and P is N.
From the table, we know N received 19 points.
If instead of Gopinath, Raghuram, who cannot identify a worker who is working pretending to work and considers him also as sincerely, is the supervisor. Then the worker with the minimum points will be
Solution
Let us fill in the points received by each worker by management at each time.
We know A = -2 : B = 5; C = 1 ; D = 0; E = 4; F = -3; G = 4
Take the total points received by each worker on 30th September and the total points received by all workers combined at a particular time.
If instead of Gopinath, Raghuram, who cannot identify a worker who is working pretending to work and considers him also as sincerely
That means a score of pretending to work corresponds to C = 1, has to be replaced by working sincerely B = 5.
Making changes in the above table by replacing C = 1 to B = 5 for each worker.
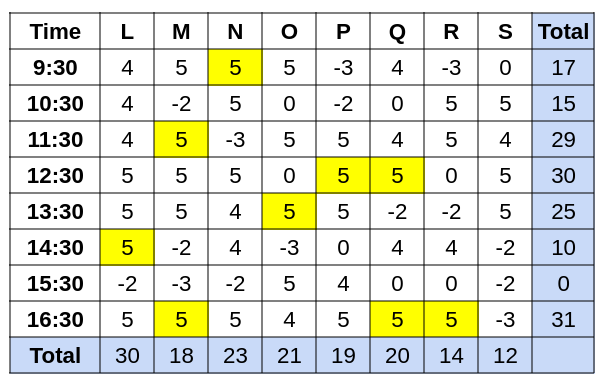
The yellow fields in the table are the places where C =1 is replaced by B = 5.
Now, the worker with the minimum points from O, S, L and M will be S = 12 points.
If the total number of working days in September is 25 and all the workers get the same points as they obtained on September 30 for everyday that they have attended in September, then the person who will get the maximum points in the month of September is :
Solution
Let us fill in the points received by each worker by management at each time.
We know A = -2 : B = 5; C = 1 ; D = 0; E = 4; F = -3; G = 4
Take the total points received by each worker on 30th September and the total points received by all workers combined at a particular time.
If the total number of working days in September is 25 and all the workers get the same points as they obtained on September 30 for everyday that they have attended in September.
We know the number of days workers were on leave in september.

Total working days = 25
So, workers were present on number of days as given below.
L = 25-5 = 20 days
M = 25-2 = 23 days
N = 25-4 = 21 days
O = 25-0 = 25 days
P = 25-10 = 15 days
Q = 25-6 = 19 days
R = 25-8 = 17 days
S = 25-9 = 16 days
Therefore, the points received will be the maximum for the worker among N, M, O and P will be
Worker points on 30th September* number of days worked by a worker in September
N = 19*21 = 399
M = 10*23 = 230
O = 17*25 = 425
P = 15*15 = 225
Hence, the maximum points were received by O = 425 points.
The sum of the points of all the workers at a specific time is called the efficiency at that time, then at which of the following times of the day was the efficiency the lowest on September $$30^{th}$$
Solution
Let us fill in the points received by each worker by management at each time.
We know A = -2 : B = 5; C = 1 ; D = 0; E = 4; F = -3; G = 4
Take the total points received by each worker on 30th September and the total points received by all workers combined at a particular time.
The sum of the points of all the workers at a specific time is called the efficiency at that time, then at which of the following times of theday was the efficiency the lowest on September $$30^{th}$$.
From the table we know that
At 10:30, efficiency = 15
At 4:30 or 16:30, efficiency = 19
At 3:30 or 15:30, efficiency = 0
At 2:30 or 14:30, efficiency = 6
Therefore, it is the lowest at 3:30.
If on September $$30^{th}$$, any worker who gets a zero in any hour and was also not at his/her work place for any hour on that day is dismissed, then how many workers were not dismissed on that day?
Solution
Let us fill in the points received by each worker by management at each time.
We know A = -2 : B = 5; C = 1 ; D = 0; E = 4; F = -3; G = 4
Taking the sum of total points received by each worker on 30th September and the total points received by all workers combined at a particular time.
If on September $$30^{th}$$, any worker who gets a zero in any hour and was also not at his/her work place for any hour on that day isdismissed
O, P , Q , R and S received 0 atleast 1 time.
Hence, they are dismissed.
Therefore, workers which were not dismissed on that day are L, M, N.
Three workers.
Answer these questions on the basis of the information given below.
A newspaper vendor picks up copies of various newspapers from a center and distributes them to his customers as per their subscription. Subscription means that the customer will receive a copy of that news paper on all days throughout the month. On the last day of each month, he prepares the bill for each customer for that month and collects the payment on the 1st day of the next month. The details of various newspapers along with their retail price per copy on weekdays (Mon-Sun) are shown below. The customers are given bills according to the retail price of the copy of the newspaper they have subscribed to.

The monthly bill of ₹74 is never possible for which of the following newspapers?
Solution
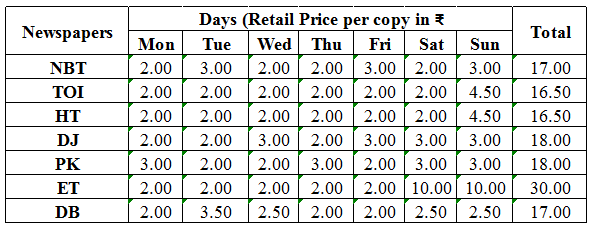
We know that in a month, the number of days can be 28,29,30 or 31.
Based on this, each newspaper's bill will be prepared for a particular month.
The monthly bill of ₹74 is never possible for which of the following newspapers?
The options are NBT, DJ, DB and PK
Let us check each option:
A) NBT
Weekly cost of NBT newspaper (7 days) = ₹17
So, for 28 days, the bill will be 17*4 = ₹68
Now, we need to find whether this newspaper's monthly bill can be ₹74 or not.
So, difference = 74-68 =₹6
Therefore, we need to check whether for any one day or two days or 3 days is equal to 6 or not for NBT and days should be consecutive.
We see that (2+3+2), (3+2+2), (2+2+3), (2+3+2), (3+2+3), (2+3+2), (3+2+3)
For none of the possible pairs of 2 or days, the sum is exactly equal to 6.
Hence, A monthly bill of ₹74 is never possible for NBT.
Let us check for other options as well.
B) DJ
Weekly cost of DJ newspaper (7 days) = ₹18
So, for 28 days, the bill will be 18*4 = ₹72
Now, we need to find out whether this newspaper's monthly bill can be ₹74.
So, difference = 74-72 =₹2
We can assume that the number of days = 29.
So, on 29th day, extra ₹2 can contribute to the monthly bill. (Either Monday, Tuesday or Thursday)
C) DB
Weekly cost of DB newspaper (7 days) = ₹17
So, for 28 days, the bill will be 17*4 = ₹68
Now, we need to find out whether this newspaper's monthly bill can be ₹74.
So, difference = 74-68 =₹6
We can assume that the number of days = 30.
So, on 29th day and 30th day, extra ₹6 can contribute to the monthly bill. (Tuesday and Wednesday)
D) PK
Weekly cost of PK newspaper (7 days) = ₹18
So, for 28 days, the bill will be 18*4 = ₹72
Now, we need to find out whether this newspaper's monthly bill can be ₹74.
So, difference = 74-72 =₹2
We can assume that the number of days = 29.
So, on the 29th day, an extra ₹2 can contribute to the monthly bill. (Either Tuesday or Wednesday or Friday)
The monthly bill of which of the following two newspapers can not be equal for any month?
Solution
We know that in a month, the number of days can be 28,29,30 or 31.
Based on this, each newspaper's bill will be prepared for a particular month.
The monthly bill of which of the following two newspapers can not be equal for any month?
Let us check each option:
A) DB and HT
Cost of DB newspaper (28 days) = ₹68 (17*4)
Cost of HT newspaper (28 days) = ₹66 (16.5*4)
So, difference = 68-66 =₹2
If we assume the number of days = 29
On the 29th day, if assumed to be Sunday, the cost of HT = ₹4.5 and cost of DB = ₹2
The monthly bill will be equal for both DB and HT.
HT = 66+4.5 = ₹70.5
DB = 68+2.5 = ₹70.5
B) PK and DJ
Cost of PK newspaper (28 days) = ₹72 (18*4)
Cost of DJ newspaper (28 days) = ₹72 (18*4)
If we assume the number of days = 28
The monthly bill will be equal for both PK and DJ.
C) NBT and DB
Cost of NBT newspaper (28 days) = ₹68 (17*4)
Cost of DB newspaper (28 days) = ₹68 (17*4)
If we assume the number of days = 28
The monthly bill will be equal for both NBT and DB.
D) DB and PK
Cost of DB newspaper (28 days) = ₹68 (17*4)
Cost of PK newspaper (28 days) = ₹72 (18*4)
So, difference = 72-68 =₹4
If we assume the number of days = 28 or 29 or 30 or 31.
For one of the following days, the difference between bill amount of DB and PK can be zero.
Hence, The monthly bill of DB and PK newspapers can not be equal for any month.
In the month of August, subscription of which two newspapers can lead to the same amount on the monthly bill of a customer?
I. PK and NBT
II. DJ and DB
III. TOI and DJ
IV. DJ and PK
Solution
We know that in a month, the number of days can be 28,29,30 or 31.
Based on this, each newspaper's bill will be prepared for a particular month.
In August, a subscription to two newspapers can cost the same on a customer's monthly bill.
In August, number of days = 31
Let us check each option:
A) PK and NBT
Cost of PK newspaper (28 days) = ₹72 (87*4)
Cost of NBT newspaper (28 days) = ₹68 (17*4)
So, difference = 72-68 = ₹4
The number of days in August = 31
The monthly bill cannot be equal for both PK and NBT because for any 3 days from the weekdays, it is not possible that the difference between NBT and PK is equal to 4.
So, their bills cannot be equal.
B) DJ and DB
Cost of DJ newspaper (28 days) = ₹72 (18*4)
Cost of DB newspaper (28 days) = ₹68 (17*4)
So, difference = 72-68 = ₹4
The number of days in August = 31
The monthly bill cannot be equal for both DJ and DB because for any 3 days from the weekdays, it is not possible that the difference between DJ and DB is equal to 4. In most cases cost of DJ is more than DB.
So, their bills cannot be equal.
C) TOI and DJ
Cost of TOI newspaper (28 days) = ₹66 (16.5*4)
Cost of DJ newspaper (28 days) = ₹72 (18*4)
So, difference = 72-68 = ₹4
The number of days in August = 31
The monthly bill cannot be equal for both TOI and DJ because for any 3
days from the weekdays, it is not possible that the difference between TOI and DJ is equal to 4. In most cases cost, they are almost equal.
So, their bills cannot be equal.
D) DJ and PK
Cost of DJ newspaper (28 days) = ₹72 (18*4)
Cost of PK newspaper (28 days) = ₹72 (18*4)
So, difference = 0
The number of days in August = 31
If we assume 29th, 30th and 31st day to be Monday, Tuesday and Wednesday, then their montly bill be equal.
DJ = 72+2+2+3 = ₹79
PK = 72+3+2+2 = ₹79
Hence, the monthly bills for DJ and PK newspapers are equal for August.
The month's bill for Mr. Jackson is ₹ 200. Which newspapers did he possibly subscribe to
Solution
We know that in a month, the number of days can be 28,29,30 or 31.
Based on this, each newspaper's bill will be prepared for a particular month.
The month's bill for Mr. Jackson is ₹ 200. Which newspapers did he possibly subscribe to
Let us check each option:
A) ET and TOI
Cost of ET newspaper (28 days) = ₹120 (30*4)
Cost of TOI newspaper (28 days) = ₹66 (16.5*4)
The sum of the bill of ET and TOI = 120+66 = ₹186
So, for a ₹200 bill, the cost of the newspaper has to be more by ₹14.
It can be from 1 or 2 or 3 extra days, assuming number of days in a month are either 29,30 or 31.
The bill combined cannot be equal to ₹200 as for ET and TOI, the sum of cost are
4, 4, 4, 4, 4, 12 and 14.50 for Monday to Sunday respectively.
The extra cost cannot be equal to 14 in any combination.
B) PK, NBT and HT
Cost of PK newspaper (28 days) = ₹72 (18*4)
Cost of NBT newspaper (28 days) = ₹68 (17*4)
Cost of HT newspaper (28 days) = ₹66 (16.5*4)
The sum for 28 days = 72+68+66 = ₹206 more than ₹200.
Hence, it is also not the correct combination.
C) NBT, DB and TOI
Cost of NBT newspaper (28 days) = ₹68 (17*4)
Cost of DB newspaper (28 days) = ₹68 (17*4)
Cost of TOI newspaper (28 days) = ₹66 (16.5*4)
The sum for 28 days = 68+68+66 = ₹202 more than ₹200.
Hence, it is also not the correct combination.
D) HT, TOI and DB
Cost of HT newspaper (28 days) = ₹66 (16.5*4)
Cost of TOI newspaper (28 days) = ₹66 (16.5*4)
Cost of DB newspaper (28 days) = ₹68 (17*4)
The sum for 28 days = 66+66+68 = ₹200
Hence, it is the correct combination.
Mr. Sharma has subscribed for ET and PK only. If ₹x is the bill of Mr. Sharma for the month of April, then the bill will be
Solution
We know that in a month, the number of days can be 28,29,30 or 31.
Based on this, each newspaper's bill will be prepared for a particular month.
Mr. Sharma has subscribed for ET and PK only. If ₹x is the bill of Mr. Sharma for the month of April, then the bill will be
A) ET and PK
Cost of ET newspaper (28 days) = ₹120 (30*4)
Cost of PK newspaper (28 days) = ₹72 (18*4)
For the remaining 2 days, the days can be any two consecutive days from Monday, Tuesday,....Saturday and Sunday.
So, calculate the total price of ET and PK for each day.
Monday = 5
Tuesday = 4
Wednesday = 4
Thursday = 5
Friday = 4
Saturday = 13
Sunday = 13
So for the minimum bill for one month, we consider two consecutive days with the lowest price of both newspapers.
That is, we assume the days are Tuesday and Wednesday.
So minimum bill = 120+72+4+4 = 200
For maximum bill, we assume the two consecutive days with the maximum price of both newspapers.
That is, we assume the two extra days are Saturday and Sunday.
So maximum bill = 120+72+13+13 = 218
So, the range of x will lie $$200 \leq x \leq 218$$
Refer to the data given in the diagram below and answer the questions that follow.

Abhay, Bhalu, Chandu, Damu, Ebrahim, Faizal, Gayatri and Hari are Ram's friends. The above diagram gives the distance of each of their houses and time taken by Ram to visit each of them.
A dark circle represents the Distance of particular person's house from Ram's house (Scale 1 division = 1.75 km).
A dark square represents the Time taken by Ram to reach a particular person's house starting from his house (Scale division = 1.2 hrs.)
Ram is travelling with maximum average speed, while going to
Solution
While going to Damu's house
The distance is $$4\times1.75=7$$ km
The time taken is $$2.5\times1.2=3$$ hours
Average speed = $$\dfrac{7}{3}=2.33$$ kmph
While going to Bhalu's house
The distance is $$4.5\times1.75=7.875$$ km
The time taken is $$2.5\times1.2=3$$ hours
Average speed = $$\dfrac{7.875}{3}=2.625$$ kmph
While going to Faizal's house
The distance is $$5\times1.75=8.75$$ km
The time taken is $$3\times1.2=3.6$$ hours
Average speed = $$\dfrac{8.75}{3.6}=2.43$$ kmph
While going to Gayatri's house
The distance is $$4\times1.75=7$$ km
The time taken is $$2\times1.2=2.4$$ hours
Average speed = $$\dfrac{7}{2.4}=2.92$$ kmph
Hence, the max average speed is 2.92 kmph
How much time will Ram take to reach Chandu's house, if he travels at the speed at which he travels to Hari's house
Solution
While going to Hari's house
The distance is $$2.5\times1.75=4.375$$ km
The time taken is $$4\times1.2=4.8$$ hours
Average speed = $$\dfrac{4.375}{4.8}=0.911$$ kmph
While going to Chandu's house
The distance is $$4.5\times1.75=4.375$$ km
As the distance and speed is same as that while going to Hari's house, the time taken will also be the same.
Hence, the time taken is 4.8 h.
If Abhay's, Ram's and Bhalu's houses are in a straight line, then how muchtime will Ram take to reach Bhalu's house from Abhay’s house,if he is travelling at 0.5 km/h?
Solution
The distance between Abhay's and Ram's house is
$$1.5\times1.75=2.625$$ km
The distance between Bhalu's and Ram's house is
$$4.5\times1.75=7.875$$ km
Hence, the total distance to be travelled is 2.625 + 7.875 = 10.5 km
Given the speed is 0.5 kmph
So, the time taken is $$\dfrac{10.5}{0.5}=21$$ h
Ebrahim, Faizal and Ram live in a Straight line, such that Ram stays between Ebrahim and Faizal. How muchtime will Ram take to travel to Faizal's house from Ebrahim's house at the speed at which he travels to Abhay's house?
Solution
The distance between Ebrahim's and Ram's house is
$$2.5\times1.75=4.375$$ km
The distance between Faizal's and Ram's house is
$$5\times1.75=8.75$$ km
Hence, the total distance to be travelled is 4.375 + 8.75 = 13.125 km
His speed while travelling to Abhay's house is $$\dfrac{1.5\times1.75}{3.5\times1.2}=0.625$$ kmph
So, the time taken is $$\dfrac{13.125}{0.625}=21$$ h
Answer the questions based on the following table, which gives data about certain coffee producers in India.

What is the maximum production capacity (in '000 tonnes) of Lipton?
Solution
We see that Lipton has a production of 1.64 tonnes. We are also given that the production facility capacity is at 64.8%.
So, if 64.8% of the capacity is 1.64 tonnes.
100% of the capacity will be, $$\frac{1.64\times\ 100}{64.8}=2.53$$
Hence, the total production capacity is at 2.53 tonnes.
The highest price of coffee per kg is for
Solution
Let's calculate the following metric: Crores per Ton for each option.
Nestle: 26.75 crores and 2.03 tonnes: 13.177 crores per ton
Mac: 17.45 crores and 1.47 tonnes: 11.87 crores per ton
Lipton: 15.25 crores and 1.26 tonnes: 12.103 crores per ton
Hence, the answer is Nestle
What per cent of the total market share (by Sales Value) is controlled by ‘others’?
Solution
Total Market (by sales value) = 132.8 Cr
Total market share (by Sales Value) controlled by ‘others’ = Total Market - Market share of (Brooke Bond + Nestle + Lipton +MAC)
= 132.8 - (31.15 + 26.75 + 15.25 + 17.45) = 42.2 Cr
Percent of the total market share (by Sales Value) controlled by ‘others’ = $$\frac{42.2}{132.8}\times\ 100$$ = 31.77% $$\approx\ $$ 32%
Option B is the answer.
What approximately is the total production capacity (in tonnes)for coffee in India?
Solution
Total Production Capacity * Capacity Utilisation = Current Production
Total Production Capacity = $$\ \frac{\ 11600}{0.613}$$ = 18923 tonnes $$\approx\ 18900\ $$ tonnes
Hence, the answer is C.
The following data shows the comparative data for state-wise literacy and population growth. Study the data carefully to answer these questions.

Which of the following states shows a higher percentage increase in female literacy than the percentage increase in total literacy?
(i) Maharashtra (ii) Himachal Pradesh (iii) Kerala
Solution
In Maharashtra,
Total Literacy Increase - 25.87%
Female Literacy Increase - 25.92% i.e. more than Total Literacy Increase.
In Himachal Pradesh,
Total Literacy Increase - 31.06%
Female Literacy Increase - 31% i.e. less than Total Literacy Increase.
In Kerala,
Total Literacy Increase - 30.17%
Female Literacy Increase - 31.2% i.e. more than Total Literacy Increase.
Hence, the answer is (i) and (iii)
For the state showing the minimum percentage increase in total literacy, the numerical ratio of the percentage increase in total literacy to the change in percentage population growth rate is nearly (take absolute values only)..............
Solution
The state showing the minimum percentage increase in total literacy is Bihar at 22.34%
The change in percentage population growth rate for Bihar is -0.04
The numerical ratio of the percentage increase in total literacy to the change in the percentage population growth rate is nearly
$$\dfrac{22.34}{0.04}=558.5$$
Hence, the answer is 558.5
The ratio of the percentage increase in female literacy to the percentage increase in total literacy is maximum for which state?
Solution
The ratio of the percentage increase in female literacy to the percentage increase in total literacy for
1) Kerala is $$\dfrac{31.2}{30.17}=1.0341$$
2) Maharashtra is $$\dfrac{25.92}{25.87}=1.0019$$
3) Manipur is $$\dfrac{29.68}{29.61}=1.0023$$
4) Madhya Pradesh is $$\dfrac{22.86}{25.58}=0.8936$$
Hence, the maximum is for Kerala.
The ratio of the overall simple average of the percentage increase in female literacy to the simple average percentage increase in female literacy of those states where the percentage increase is more than the overall average is .............
Solution
The overall simple average of the percentage increase in female literacy is
$$\dfrac{23.32+19.48+26.2+28.67+31+26.63+31.2+22.86+25.92+29.68}{10}=26.496$$
The simple average of percentage increase in female literacy of those states where the percentage increase is more than the overall average is
$$\dfrac{28.67+31+26.63+31.2+29.68}{5}=29.436$$
Hence, the ratio is $$\dfrac{26.496}{29.436}=0.90$$
Hence, the answer is Option C.
The ratio of the simple overall average of the percentage increase in female literacy to the simple overall average of the percentage increase in total literacy is approximately equal to ___.
Solution
The overall simple average of the percentage increase in female literacy is
$$\dfrac{23.32+19.48+26.2+28.67+31+26.63+31.2+22.86+25.92+29.68}{10}=26.496$$
The simple overall average of the percentage increase in total literacy is
$$\dfrac{25.17+22.34+27.21+29.19+31.06+27.52+30.17+25.58+25.87+29.61}{10}=27.372$$
Hence, the ratio is $$\dfrac{26.496}{27.372}=0.968$$
Hence, the answer is Option B.
Which state exhibits the highest total literacy?
Solution
The highest percentage increase in total literacy is exhibited by Himachal Pradesh at 31.06%
The following bar chart shows the composition of the GDP of two countries (India and Sri Lanka)

What fraction of India's GDP is accounted for by Services?
Solution
From the given graph, we can see that India's GDP stacked bar graph
Services account for 20% of it.
20% is 0.2 or 1/5
Hence, the answer is $$\frac{1}{5}th$$
If the total GDP of Sri Lanka is ₹10,000 crore, then the GDP accounted for by Manufacturing is
Solution
20% of Sri Lanka's GDP is manufacturing. The GDP is given to be 10000 crore.
20% of that will be 0.2(10000)=2000 crore.
If the total GDP of India is ₹30,000 crore, then the GDP accounted for by Agriculture, Services and Miscellaneous is
Solution
Manufacturing is 40%
Services is 20%
Miscellaneous is 10%
Total is 70%.
GDP is given to be 30000 crore. 70% of that will be 21000 crore.
Which country accounts for higher earning out of Services and Miscellaneous together?
Solution
It cannot be determined as this graph only provides the percentages of the GDP; the absolute figures are not given. Hence, even though for both the countries, services and miscellaneous together account for 30% we cannot say for certain due to the fact the absolute figures for the GDP is not given.
If the total GDP is the same for both the countries, then by what percentage is Sri Lanka's income through agriculture more than India's income through services?
Solution
Let's say that India's and Sri Lanka's GDPs are 100X.
Sri Lanka's manufacturing will be 40X, and India's services will be 20X.
That means Sri Lanka's manufacturing part of GDP is 100% more than India's services.
Each of these questions has a statement followed by two conclusions numbered as I and II. Consider the statement and the following conclusions. Decide which of the conclusions follows from the statement. Mark answer as
Statement :
There is mounting concern that water will be a flash point for political, social and economic turmoil.
Conclusions:
I. Water faces an endemic global shortage.
II. The scarcity of water will have serious repercussions on our lives.
Solution
Since water is said to be a flash point for every sphere, it is clear that there is currently a decrease in its quantity, which will have serious repercussions on our lives. Otherwise, there can be no reason for it to play such a role as a flash point in all the spheres.
Hence, both conclusions are valid.
Statement : Cardiac myopathy is marked by an increase in the size of heart and decrease in the efficiency of pumping.
Conclusions :
I. The bigger the size of heart the better it works.
II. The efficiency of the heart is inversely proportional to the size of the heart.
Solution
The statement talks about the two effects of cardiac myopathy on hearts: An increase in size and a decrease in efficiency.
However, we cannot state the size of the heart is inversely proportional to the efficiency. It might be the case that this is a coincidental effect of cardiac myopathy, which is not the same in general conditions. Hence, the second conclusion is invalid.
The first option is again vague and slightly against the main premise, as there is nothing that speaks about the enhanced efficiency of a bigger heart.
Statement: Some religious gurus preach austerity to poor while living in luxury and driving Mercedes.
Conclusions:
I. Some of the frauds have donned the garb of religious god men.
II. There is a world of difference between preaching and practising.
Solution
Since the main premise shows how the religious gurus preach something while not practicing the same, the second conclusion shall hold true in this regard.
The first conclusion, however, is out of scope as it deals with fraudulent acts that is not covered under the main premise.
Statement : Every natural remedy is not necessarily harmless and should be used with caution.
Conclusions:
I. The natural remedies are not scientifically proven.
II. Everything natural has no side effect.
Solution
The main premise asks us to be careful while using natural remedies since not all of them are harmless.
The first conclusion is incorrect since we don't have any information with respect to the scientific testing of natural remedies.
The second conclusion is incorrect again, since it directly goes against the main premise.
Statement : Summer heralds, the arrival of mosquito borne diseases such as malaria, dengue and chickunguniya.
Conclusions :
I. Mosquito bites are harmless during winter, autumn and spring season.
II. Mosquitoes breed rapidly during summers.
Solution
The statement merely talks about summer being a hotspot for mosquito borne diseases. There is no information about the bites being harmless in other seasons or the season allowing mosquitoes to breed rapidly. There might be other factors influencing the same.
Study the information below to answer these questions.
Five persons, Amrinder, Bishamber, Chidambaram, Digamber and Inder of a family eat grapes, apples, cherries, mangoes and pineapples not in the order as mentioned,after lunch, from Tuesday to Saturday. No member eats any fruit on Sundays and Mondays. Each member eats only one fruit on
one day and does not repeat it during the same week. No two members can eat the same fruit on the same day.
* Inder does not eat cherries or grapes on Wednesday.
* Amrinder eats cherries on Tuesday.
* Digamber eats apples on Tuesday.
* Inder does not take pineapples on Tuesday but takes apples on Thursday.
* Bishamber eats pineapples on Friday.
* Chidambaram eats grapes on Saturday, cherries on Wednesday and mangoes on Thursday.
* Digamber eats pineapples on Wednesday.
Which fruit does ‘Inder’ eat on Wednesday?
Solution
Let Amrinder, Bishamber, Chidambaram, Digamber and Inder be A, B, C, D and I, respectively.
Based on the information given, let's draw a table:
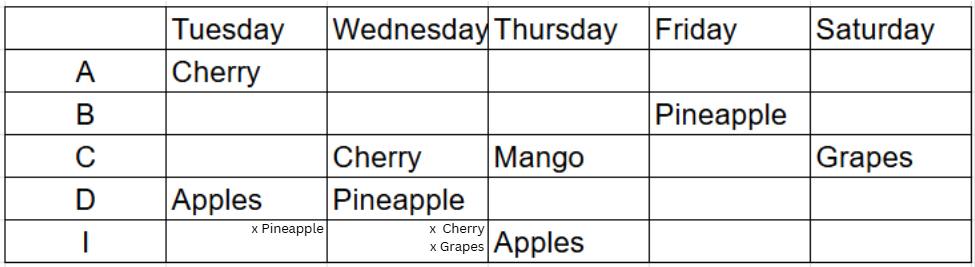
On Tuesday, Bishamber cannot have Pineapples as he has it on Friday, so on Tuesday, Chidambaram will have Pineapple, and therefore he will have Apples on Friday.
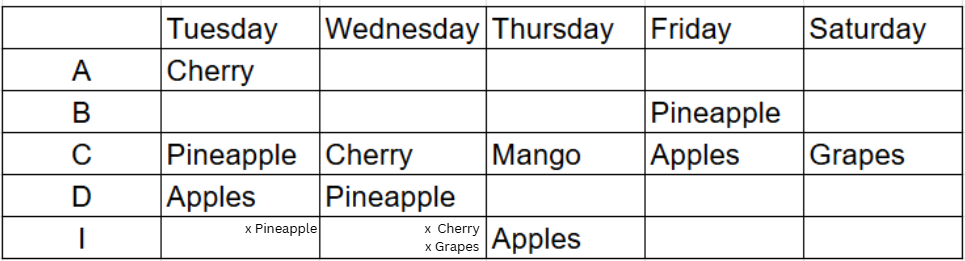
Inder cannot have Pineapple, Cherry, Grapes or Apples on Wednesday, so he must have Mango. Then, On Tuesday, Bishambar should have Mango and Inder will have Grapes.
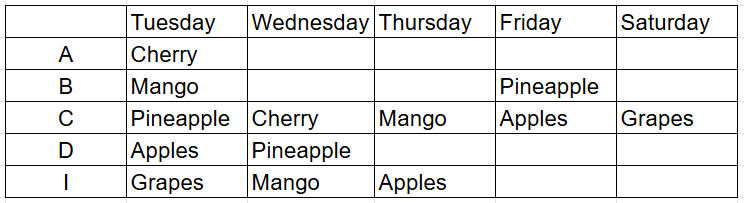
Now, Inder should have Pineapple on Saturday and Cherry on Friday. Therefore, Amrinder should have pineapple on Thursday.
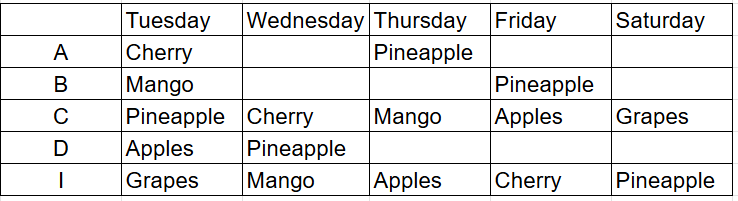
Based on the table, we can see that Inder eats Mangoes on Wednesday.
Who eats ‘mangoes’ on “Tuesday’?
Solution
Let Amrinder, Bishamber, Chidambaram, Digamber and Inder be A, B, C, D and I, respectively.
Based on the information given, let's draw a table:
On Tuesday, Bishamber cannot have Pineapples as he has it on Friday, so on Tuesday, Chidambaram will have Pineapple, and therefore he will have Apples on Friday.
Inder cannot have Pineapple, Cherry, Grapes or Apples on Wednesday, so he must have Mango. Then, On Tuesday, Bishambar should have Mango and Inder will have Grapes.
Now, Inder should have Pineapple on Saturday and Cherry on Friday. Therefore, Amrinder should have pineapple on Thursday.
Based on the table, we can see that Bishambar eats Mangoes on Tuesday.
Which fruit can Chidambaram take on Tuesday ?
Solution
Let Amrinder, Bishamber, Chidambaram, Digamber and Inder be A, B, C, D and I, respectively.
Based on the information given, let's draw a table:
On Tuesday, Bishamber cannot have Pineapples as he has it on Friday, so on Tuesday, Chidambaram will have Pineapple, and therefore he will have Apples on Friday.
Inder cannot have Pineapple, Cherry, Grapes or Apples on Wednesday, so he must have Mango. Then, On Tuesday, Bishambar should have Mango and Inder will have Grapes.
Now, Inder should have Pineapple on Saturday and Cherry on Friday. Therefore, Amrinder should have pineapple on Thursday.
Based on the table, we can see that Chidambaram eats Pineapples on Tuesday.
Study the information below to answerthese questions.
There are six boys in a group. Mahesh and Ramesh are in the Hockey team together. Parvesh has defeated Ramesh in badminton butlost to Suresh in tennis. Mahesh and Parvesh are in opposite teams of basketball. Naresh represents his state in cricket while Samresh does so at the district level. Boys who play chess don’t play football, basketball or volleyball. Mahesh and Parvesh are together in the volleyball team. Boys who play football also play hockey. Suresh plays chess and competes with Ramesh. Naresh and Samresh are good footballers. Suresh also plays hockey and tennis quite well.
Name the boys who don’t play the game of football?
Solution
From the given statements on individuals and them playing with/against each other, we can draw the following conclusions:
Mahesh- Hockey, Basketball, Volleyball
Ramesh- Hockey, Badminton, Chess
Parvesh- Badminton, Tennis, Basketball, Volleyball
Suresh- Tennis, Chess, Hockey, Tennis
Naresh- Cricket, Football
Samresh- Cricket, football
Now, we know that boys who play chess don’t play football, basketball, or volleyball.
It is also given that boys who play football also play hockey. Hence, Naresh and Samresh shall also play hockey.
Final table:
Mahesh- Hockey, Basketball, Volleyball (cannot play: Chess)
Ramesh- Hockey, Badminton, Chess (cannot play: football, basketball, or volleyball)
Parvesh- Badminton, Tennis, Basketball, Volleyball (cannot play: Chess)
Suresh- Tennis, Chess, Hockey, Tennis (cannot play: football, basketball, or volleyball)
Naresh- Cricket, Football, Hockey (cannot play: Chess)
Samresh- Cricket, football, Hockey (cannot play: Chess)
Ramesh and Suresh can't play football as they play chess.
Which player plays the maximum number of games ?
Solution
From the given statements on individuals and them playing with/against each other, we can draw the following conclusions:
Mahesh- Hockey, Basketball, Volleyball
Ramesh- Hockey, Badminton, Chess
Parvesh- Badminton, Tennis, Basketball, Volleyball
Suresh- Tennis, Chess, Hockey, Tennis
Naresh- Cricket, Football
Samresh- Cricket, football
Now, we know that boys who play chess don’t play football, basketball, or volleyball.
It is also given that boys who play football also play hockey. Hence, Naresh and Samresh shall also play hockey.
Final table:
Mahesh- Hockey, Basketball, Volleyball (cannot play: Chess)
Ramesh- Hockey, Badminton, Chess (cannot play: football, basketball, or volleyball)
Parvesh- Badminton, Tennis, Basketball, Volleyball (cannot play: Chess)
Suresh- Tennis, Chess, Hockey, Tennis (cannot play: football, basketball, or volleyball)
Naresh- Cricket, Football, Hockey (cannot play: Chess)
Samresh- Cricket, football, Hockey (cannot play: Chess)
Parvesh plays the maximum number of games out of the given options.
Which is the most popular game with this group of boys ?
Solution
From the given statements on individuals and them playing with/against each other, we can draw the following conclusions:
Mahesh- Hockey, Basketball, Volleyball
Ramesh- Hockey, Badminton, Chess
Parvesh- Badminton, Tennis, Basketball, Volleyball
Suresh- Tennis, Chess, Hockey, Tennis
Naresh- Cricket, Football
Samresh- Cricket, football
Now, we know that boys who play chess don’t play football, basketball, or volleyball.
It is also given that boys who play football also play hockey. Hence, Naresh and Samresh shall also play hockey.
Final table:
Mahesh- Hockey, Basketball, Volleyball (cannot play: Chess)
Ramesh- Hockey, Badminton, Chess (cannot play: football, basketball, or volleyball)
Parvesh- Badminton, Tennis, Basketball, Volleyball (cannot play: Chess)
Suresh- Tennis, Chess, Hockey, Tennis (cannot play: football, basketball, or volleyball)
Naresh- Cricket, Football, Hockey (cannot play: Chess)
Samresh- Cricket, football, Hockey (cannot play: Chess)
Hockey is played by five people, making it the most popular game.
Study the information below to answer these questions.
There are five types of cards namely A, B, C, D and E andthere are in all 15 cards,i.e., three cards of each type. These cards are tobe
inserted in 15 envelopes. There are three colours of these envelopes namely red, yellow and brown. There arefive envelopes of each colour.
* B, D and E types of cards are inserted in red envelopes.
* A, B and C types of cards are to be inserted in yellow envelopes.
* C, D, E are types of cards to be inserted in brown envelope.
* Two Cards each of B and D types are enclosed in red envelopes
Which ofthe following combinationsof types of cards and the numberof cards are definitely correct in respectof yellow colouredenvelop
Solution
We have the following information: (Type, Colour)
1 and 4. B-R, D-R, E-R, B-R, D-R............ Red
2. A-Y, B-Y, C-Y............ Yellow
3. C-B, D-B, E-B.............. Brown
Now, we are left with 2 of A, 1 of C, and 1 of E.
We also have two yellow envelopes and two brown envelopes.
It is given that A has to be in yellow envelopes. Hence, both the remaining cards from A shall go to yellow envelopes.
This means. the left-out cards from C and E shall go to brown envelopes.
Final:
Red: B,B,D,D,E
Yellow: A,A,A,B,C
Brown: C,D,E,C,E
In yellow, we have A-3, B-1, and C-1.
Which ofthe following combinations of colour of the envelope and the number of cards are definitely correct in respect of E-type of cards ?
Solution
We have the following information: (Type, Colour)
1 and 4. B-R, D-R, E-R, B-R, D-R............ Red
2. A-Y, B-Y, C-Y............ Yellow
3. C-B, D-B, E-B.............. Brown
Now, we are left with 2 of A, 1 of C, and 1 of E.
We also have two yellow envelopes and two brown envelopes.
It is given that A has to be in yellow envelopes. Hence, both the remaining cards from A shall go to yellow envelopes.
This means. the left-out cards from C and E shall go to brown envelopes.
Final:
Red: B,B,D,D,E
Yellow: A,A,A,B,C
Brown: C,D,E,C,E
Hence, for E: 1 red, 2 brown.
Whichof the following combinationsoftypes of cards and the number ofcards and colour of envelope are definitely correct ?
Solution
We have the following information: (Type, Colour)
1 and 4. B-R, D-R, E-R, B-R, D-R............ Red
2. A-Y, B-Y, C-Y............ Yellow
3. C-B, D-B, E-B.............. Brown
Now, we are left with 2 of A, 1 of C, and 1 of E.
We also have two yellow envelopes and two brown envelopes.
It is given that A has to be in yellow envelopes. Hence, both the remaining cards from A shall go to yellow envelopes.
This means. the left-out cards from C and E shall go to brown envelopes.
Final:
Red: B,B,D,D,E
Yellow: A,A,A,B,C
Brown: C,D,E,C,E
Option 2 is correct.
Study the Information below to answer the questions.
Seven friends namely Anand, Dedphk, Varun’ Ujjawal, Pritam, kadir and Jasmeet live in three different buildings namely Ashiana. Top-Hill and Ridge. Each person is flying a kite of his choice with a different colour like red, green, blue, white, black, yellow, and pink, not necessarily in that order.
* Kadir is flying a pink kite and lives in the same building where Jasmeet stays, i.e., “Ashiana’.
* Varun is flying a black kite and does not live in Ridge building.
* Ujjawal does not live in the same building where Anand or Pritam are living and is flying a Yellow coloured kite.
* Deepak lives in Ridge building with one more person and is flying a green kite.
* None living in Top-Hill building flies a white kite.
* Only two persons are staying in Ridge building while three of them are staying in Top-Hill building.
* Pritam does not fly a blue kite and stays in Top-Hill.
Who is flying the “Blue’ kite ?
Solution
Representation: Name, Colour, Building
We know that two people live Ashiana, three in top hill, and two in ridge.
From the conditions, we can conclude:
Kadir-Pink-Ashiana
Jashmeet-_-Ashiana
Varun-Black-Ashiana/Top hill
Ujjwal-Yellow-_
Deepak-Green-Ridge
Pritam-_-Top hill
Anand-_-_
Now, all the Ashiana slots are taken, hence, Varun shall stay in top hill.
Hence, it is Varun-black-top hill
We are left with One top hill, and one ridge. In colours, we have Blue, white, and red.
It is given that Pritam does not fly blue kite and none of the persons staying in top hill fly white kite. Hence, Pritam shall fly red kite.
Now, it is Pritam-Red-Top hill
We know that Ujjwal stays in a building different from Anand and Pritam. Hence, he shall live in Ridge/Ashiana. Since Ashiana slots are full, Ujjwal shall take Ridge (Ujjwal-Yellow-Ridge).
Now, it is clear that Anand will live in top hill (since all other slots are full). Further, no one in top hill can fly white kite, which means Anand shall have blue kite.
hence, Anand-Blue-top hill.
In the end, for jashmeet, we only have white kite.
Hence, Jashmeet-White-Ashiana.
From this, we know Anand flies blue kite.
Who are staying in Top-Hill building ?
Solution
Representation: Name, Colour, Building
We know that two people live Ashiana, three in top hill, and two in ridge.
From the conditions, we can conclude:
Kadir-Pink-Ashiana
Jashmeet-_-Ashiana
Varun-Black-Ashiana/Top hill
Ujjwal-Yellow-_
Deepak-Green-Ridge
Pritam-_-Top hill
Anand-_-_
Now, all the Ashiana slots are taken, hence, Varun shall stay in top hill.
Hence, it is Varun-black-top hill
We are left with One top hill, and one ridge. In colours, we have Blue, white, and red.
It is given that Pritam does not fly blue kite and none of the persons staying in top hill fly white kite. Hence, Pritam shall fly red kite.
Now, it is Pritam-Red-Top hill
We know that Ujjwal stays in a building different from Anand and Pritam. Hence, he shall live in Ridge/Ashiana. Since Ashiana slots are full, Ujjwal shall take Ridge (Ujjwal-Yellow-Ridge).
Now, it is clear that Anand will live in top hill (since all other slots are full). Further, no one in top hill can fly white kite, which means Anand shall have blue kite.
hence, Anand-Blue-top hill.
In the end, for jashmeet, we only have white kite.
Hence, Jashmeet-White-Ashiana.
From this, we know Anand, Pritam, and Varun stay in top hill.
Who are living in Ridge building ?
Solution
Representation: Name, Colour, Building
We know that two people live Ashiana, three in top hill, and two in ridge.
From the conditions, we can conclude:
Kadir-Pink-Ashiana
Jashmeet-_-Ashiana
Varun-Black-Ashiana/Top hill
Ujjwal-Yellow-_
Deepak-Green-Ridge
Pritam-_-Top hill
Anand-_-_
Now, all the Ashiana slots are taken, hence, Varun shall stay in top hill.
Hence, it is Varun-black-top hill
We are left with One top hill, and one ridge. In colours, we have Blue, white, and red.
It is given that Pritam does not fly blue kite and none of the persons staying in top hill fly white kite. Hence, Pritam shall fly red kite.
Now, it is Pritam-Red-Top hill
We know that Ujjwal stays in a building different from Anand and Pritam. Hence, he shall live in Ridge/Ashiana. Since Ashiana slots are full, Ujjwal shall take Ridge (Ujjwal-Yellow-Ridge).
Now, it is clear that Anand will live in top hill (since all other slots are full). Further, no one in top hill can fly white kite, which means Anand shall have blue kite.
hence, Anand-Blue-top hill.
In the end, for jashmeet, we only have white kite.
Hence, Jashmeet-White-Ashiana.
From this, we know Deepak and Ujjwal stay in Ridge building.
Study the Information below to answer these questions.
There are five friends in a group, namely Arvind Mohan, Barkat Rai, Chandram Singh, Daya Singh and Arjun Singh. All of them are engaged in different professions like they are horticulturist, physician, journalist, industrialist, and an advocate, though not in this order.
* Three of them, ie., Arvind Mohan, Chandram Singh and the advocate prefer tea to coffee and two of them, i.c., Barkat Rai and the journalist prefer coffee to tea.
* Daya Singh, Arvind Mohan and the industrialist are very close friends but two of them prefer coffee to tea.
* Thehorticulturist is physician’s brother.
* Chandram Singh did his MBBS. from Bhopal and Arjun Singh got his law degree from Indore.
Who is the Horticulturist ?
Solution
Representation: Name initials - tea/coffee - Profession
For instance Arvind Mohan shall be written as AM.
We know that:
AM- T - __
CS- T - ___
BR - C- ___
DS - __ - __
AS - __ - Advocate
Now, Advocate prefers tea. Hence, AS - T - Advocate
This means, DS has to prefer coffee as two people prefer coffee. Also, Barkat Rai and the journalist prefer coffee. Hence, DS - C - Journalist.
Chandram Singh has MBBS, hence he shall be the physician. This means, CS - T- Physician.
Now, we know that DS, AM, and the industrialist are close friends in which two of them prefer coffee. One shall be DS, and the other shall be BR, who is an industrialist.
Hence, BR- C - Industrialist.
This means, AM - T- Horticulturalist.
Hence, C is the correct answer.
Which of the following groups includes persons who like tea but none in the group is an advocate ?
Solution
Representation: Name initials - tea/coffee - Profession
We know that:
AM- T - __
CS- T - ___
BR - C- ___
DS - __ - __
AS - __ - Advocate
Now, Advocate prefers tea. Hence, AS - T - Advocate
This means, DS has to prefer coffee as two people prefer coffee. Also, Barkat Rai and the journalist prefer coffee. Hence, DS - C - Journalist.
Chandram Singh has MBBS, hence he shall be the physician. This means, CS - T- Physician.
Now, we know that DS, AM, and the industrialist are close friends in which two of them prefer coffee. One shall be DS, and the other shall be BR, who is an industrialist.
Hence, BR- C - Industrialist.
This means, AM - T- Horticulturalist.
CS, AS, and AM like tea. But AS is an advocate. Hence, the correct option is D.
Who is the Physician ?
Solution
Representation: Name initials - tea/coffee - Profession
We know that:
AM- T - __
CS- T - ___
BR - C- ___
DS - __ - __
AS - __ - Advocate
Now, Advocate prefers tea. Hence, AS - T - Advocate
This means, DS has to prefer coffee as two people prefer coffee. Also, Barkat Rai and the journalist prefer coffee. Hence, DS - C - Journalist.
Chandram Singh has MBBS, hence he shall be the physician. This means, CS - T- Physician.
Now, we know that DS, AM, and the industrialist are close friends in which two of them prefer coffee. One shall be DS, and the other shall be BR, who is an industrialist.
Hence, BR- C - Industrialist.
This means, AM - T- Horticulturalist.
CS is the physician.
In each of these questions, two Statements numbered as I & II are provided. These may have a cause and effect relationship or may have independent causes or be the effects of independent causes. Read the statements and mark answer as
Statement I: Most of the private schools have increased the tuition fees in Delhi this year to meet their expenses.
Statement II: The tuition fees in government-run schools have not been hiked in spite of the unexpected price rise witnessed this year.
Solution
The two statements talk about the rise in price and how private and government schools have responded differently to it.
Hence, it is clear that the main cause is rise in prices and the two statements are effects of the same.
Statement I: The results of the students of science stream of class XI in the Kendriya Vidyalayas this year were excellent.
Statement II : Many teachers of Kendriya Vidyalayas have left these schools and joined private schools.
Solution
The first statement talks about excellent results from the school, while the second talks about many teachers leaving the school and joining other private schools. It is clear that the former is a positive statement, but the latter changes the discourse of the discussion completely.
Hence, they must be the effects of two independent causes.
Statement I: If we incorporate fruits as part of our meals, we avoid excess calories in our daily in-take. Fruits are wholesome and have a very high water content.
Statement II: Many fruits like watermelon or cucumber are calorie-burners as digesting them burns more calories than eating them.
Solution
The first statement talks about incorporating fruits into our diet to cut down on calories while not compromising on nutrients. The second statement then points out certain fruits that even go further in acting as calorie-burners.
Hence, the statements are connected, but they are effects of some common cause, since both of them talks about the benefits of fruits in the diet.
Statement I : World Health Organization believes that one in 10 hospital admissions leads to an adverse event and one in 300 admissions in death. Unintended medical errors are a big threat to patient safety.
Statement II: American Medical Association claims and quantifies that there are nearly 2000 deaths due to unnecessary surgery. 7000 deaths from medication errors, 8000 deaths from infections and nearly 16000 deaths due to adverse effects of medicines.
Solution
Both statements discuss the unintended medical errors or adverse effects of medical practices/medicines, as pointed out by WHO and the American Medical Association, and provide statistics related to the same. However, there is no causal effect relationship between them because they independently talk about the topic and numbers. Hence, they must be effects of some common cause because of them being from the same topic.
Statement I: A bone ossification test conducted by AIIMS doctors has led to the release of a man who spent 11 years behind bars on charges of murder despite being a juvenile at the time of offence.
Statement II: As per the calculation done by High Court Judge, Fahroog must have been not more than 17 years when he committed the crime and should have been tried as per the Juvenile Justice Act, and should not have been imprisoned for over 3 years for crimes including murder.
Solution
Statement 1 talks about the test conducted by AIIMS, and Statement 2 talks about the judge reassessing the earlier order on the basis of the test reports. Hence, it is clear that 1 is the cause, and 2 is the effect (since the test led to judge reassessing the order).
In each of these questions, choose the missing term(s) out of the given alternatives.

Solution
The elements in first row are
A S 23
C U 29
E W 31
If we look closely, the pattern followed is
A+2 = C, C+2 = E
S+2 = U, U+2 = W
23,29,31 are the consecutive prime numbers.
Similarly, this pattern is followed in the second row as well
G Y 37
I A 41
K C 43
G+2 = I, I+2 = K
Y+2 = A, A+2 = C
37,41,43 are consecutive prime numbers.
Then, in third row.
M E 47
M+2 = O
E+2 = G
47 and next is 53
Thus, Option C is the correct answer.

Solution
If we look at the elements in the first row,
$$K_7\ L_5\ M_3$$
K, L and M are consecutive digits
The middle number 5 is the average of 2 extreme numbers 7+3 = 10 and 10/2 = 5
Similarly, for the second row,
$$L_9\ M_7\ K_5$$
From the first row, KLM, now LMK, this is the pattern.
9+5 = 14 and 14/2 = 7
So, for the last row
$$M_{11}\ L_9$$
We know that (11+x)/2 = 9
x = 7
From options, only $$K_7$$ is possible.

Solution
If you look at the elements written outside the circle, they are
A E I O U A _ I
They are vowels in sequence, hence ? will be E.
Also, the numbers written inside the circular parts are 1,3,5,7,11 ?,17 and 19.
These are prime numbers.
Hence, ? will be 13
So, E and 13

Solution
Looking at the elements outside the table, we see the following pattern.
A+3 = D
D+3 = G
G+3 = J
..
..
..
E+3 = H
H+3 = K
Also, if you look at the first column,
3*3+2*2+1*1 = 9+4+1 = 14
Second column = 4*4+6*6+8*8 = 16+36+64 = 116
Third column = 7*7+5*5+9*9 = 155
Hence, K and 155.

Solution
Looking at the elements outside the table, we see the following pattern.
A+4 = E
E+4 = I
I+4 = M
..
..
..
S+4 = W
W+4 = A
Also, if you look at the first column,
81+39-15 = 105
Second column = 18+93-51 = 60
Third column = 62+63-45 = 80
Hence, A and 80
Read the following information to answerthese questions.
* There is a family of seven personsrepresenting three generations.
* There are two married couples. Both the wives ate housewives and both have only two children.
* Ramcharan,the lawyer,is the father of Rohit and has two grand children.
* Monica, the doctor, is the sister of the teacher.
* Sudha’s daughter-in-law Asha is married to a teacher.
* Shikha, the grand daughter of one of the housewives,is studying in the 8" standard.
What is the profession of Rohit ?
Solution
From the above statements, we can conclude that Ramcharan (lawyer) is from the first generation, with his wife being Sudha because she has a daughter-in-law.
Now, Rohit is the son of Ramcharan, and Monica(doctor) is the sister of a teacher. It is also given that Asha is married to a teacher. Since there can be only two couples, we can say that Rohit (teacher) is married to Asha, and Monica (doctor) is his sister. Now, the Rohit shall have two children as per the conditions (each housewife shall have two children), and one of them shall be Shikha.
Rohit is a teacher (option C).
Which of the following groups is associated with all the three generations ?
Solution
From the above statements, we can conclude that Ramcharan (lawyer) is from the first generation, with his wife being Sudha because she has a daughter-in-law.
Now, Rohit is the son of Ramcharan, and Monica(doctor) is the sister of a teacher. It is also given that Asha is married to a teacher. Since there can be only two couples, we can say that Rohit (teacher) is married to Asha, and Monica (doctor) is his sister. Now, the Rohit shall have two children as per the conditions (each housewife shall have two children), and one of them shall be Shikha.
Ramcharan (first), Monica (second), and Shikha (third).
Which of the following statements is nottrue ?
Solution
From the above statements, we can conclude that Ramcharan (lawyer) is from the first generation, with his wife being Sudha because she has a daughter-in-law.
Now, Rohit is the son of Ramcharan, and Monica(doctor) is the sister of a teacher. It is also given that Asha is married to a teacher. Since there can be only two couples, we can say that Rohit (teacher) is married to Asha, and Monica (doctor) is his sister. Now, the Rohit shall have two children as per the conditions (each housewife shall have two children), and one of them shall be Shikha.
From this, we cannot say for sure if Sudha has two grand daughters as we only know about one (Shikha). Rest all the statements are true.
For the following questions answer them individually
Radhika moved a distance of 80 metres towards North. She then turned to the left and after walking for another 20 metres, turned to the left again. She walked for another 80 metres. Finally, she turned to the right at an angle of 45°. In which direction was she movingfinally ?
Solution
North ----- left (now, west) ----- left (now, south) ------ right 45 degree (now, south west as initial direction was south).
Hence, she is moving in the south west direction.
Raghurbir drove 15kms northwards by his car.He then turned towards west and drove for 10 kms.He then drove towards south for 5 kms and then turned towards east and drove for next 8 kms.Finally he turned to right and drove for next 10kms . How far and in which direction is Raghubir from his starting point?
Solution
The resultant displacement of Raghubir shall be 2 km to the west of the starting point.
Krishna walks for 10km towards the North. From here, he walks back 6km towards the South. Then he walks 3km towards the East. How far and in which direction is he with reference to his starting point?
Solution
It is given that Krishna walks 10km North and then 6km back south, so effectively, he has walked 4 km North.
It is then given that he walks 3km East.
North and East are directions that are at right angles to each other. We know he has walked 4km North and 3km East,
To find the distance to his starting point, we use the Pythagoras theorem to find the effective distance
$$\sqrt{3^2+4^2}=5$$
Hence, the answer is 5km North-East.
Each of these questions has an assertion (A) and a reason (R).
Assertion (A): A person jumping out of the moving train falls forward because his feet suddenly come to rest, while his body is in motion with the train.
Reason(R): This is based on Newton's first law of motion, which states that a body remains at rest or in uniform motion unless acted on by an external force.
Solution
The assertion is correct, as a person jumping off the train falls forward. However, this happens mainly because of a change in inertia, and the reason given here does not actually elaborate on inertia, while it is true about Newton's first law of motion. Hence, both A and R are true, but R is not the correct explanation about A.
Assertion (A): Gandhiji withdrew the Non-Cooperation Movement in India for some time.
Reason (R): Gandhiji believed in non-violence, but the protestations by people against the British rule at Chauri-Chaura turned violent. This event disappointed Gandhiji.
Solution
Gandhiji indeed withdrew from the Non-Cooperation movement for some time. This mainly happened because the non-violent means were being compromised by certain groups, and there were incidents of violence. Hence, both A and R are true in this case, and R is the correct explanation of A.
Assertion (A): A parachute enables a person to descend safely from a height in case of an accident.
Reason(R): A parachute is made of a fabric with a limited air permeability and has a very large frontal area . When it falls through the air, it experiences heavy air resistance. The forces of lift and drag due to airflow balance the weight of the parachutist, so that the parachutist descends at a constant, slow speed.
Solution
A talks about parachutes enabling a person to descend from height at a slower and safer speed. Its explanation is correctly given by R, which talks about the material of a parachute and how the mechanism helps in descending at a slower speed. Hence, both statements are true and R is the correct explanation of A.
Assertion (A):It is difficult to cook food on the hills.
Reason(R):The atmospheric pressure on the hills is quite low because which water starts boiling at a low temperature and therefore it takes longer to cook food on hills
Solution
Both A and R are true, and R correctly explains as to why cooking is tedious on hills.
