 91- 6303239042


Examples 4.1-4.8
Example 4.1 Consider two postmen. They start walking towards each other from a distance of 210 yojanas (Yojana is a unit of distance used in ancient India). One travels 9 yojanas per day and the other covers 5 yojanas per day. Can you determine in how many days they will meet each other?
Solution
Given data
- Initial distance between the two postmen $$D = 210\,\text{yojanas}$$
- Speed of first postman $$v_1 = 9\,\text{yojanas\ day}^{-1}$$
- Speed of second postman $$v_2 = 5\,\text{yojanas\ day}^{-1}$$
Step 1 · Identify the type of motion
Both postmen start at the same time and walk towards each other. Hence the distance between them decreases at the combined or relative speed
$$v_{\text{rel}} = v_1 + v_2$$
$$v_{\text{rel}} = 9 + 5 = 14\,\text{yojanas\ day}^{-1}$$
Step 2 · Time needed to cover the initial separation
The time $$t$$ required is the initial distance divided by the relative speed:
$$t = \dfrac{D}{v_{\text{rel}}} = \dfrac{210}{14}\,\text{days}$$
Carry out the division:
$$t = 15\,\text{days}$$
Conclusion
The two postmen will meet after
\[\boxed{t = 15\,\text{days}}\]Answer
They meet after 15 days.
Example 4.2
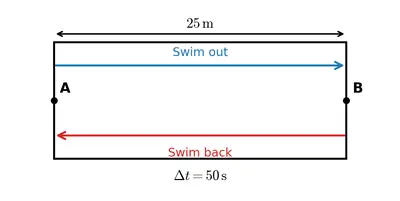
Solution
The length of the pool shown in Fig. 4.7 is given as $$L = 50\,\text{m}$$.
Time taken for the complete to–fro trip:
$$t = 50\,\text{s}$$
1. Total distance travelled
He goes from one end to the other and back to the starting point, so
$$\text{distance} = L + L = 2L = 2 \times 50\,\text{m} = 100\,\text{m}$$
2. Average speed
$$v_{\text{avg}} = \frac{\text{total distance}}{\text{total time}} = \frac{100\,\text{m}}{50\,\text{s}} = 2\,\text{m\,s}^{-1}$$
\[v_{\text{avg}} = 2\,\text{m\,s}^{-1}\]3. Displacement
Initial and final positions coincide, hence
$$\text{displacement} = 0\,\text{m}$$
4. Average velocity
$$\vec v_{\text{avg}} = \frac{\text{displacement}}{\text{time}} = \frac{0\,\text{m}}{50\,\text{s}} = 0\,\text{m\,s}^{-1}$$
\[v_{\text{avg}} = 0\,\text{m\,s}^{-1}\]Therefore, Sarang's average speed is $$2\,\text{m\,s}^{-1}$$, while his average velocity is zero.
Answer
Average speed = $$2\,\text{m s}^{-1}$$; Average velocity = $$0\,\text{m s}^{-1}$$
Example 4.3
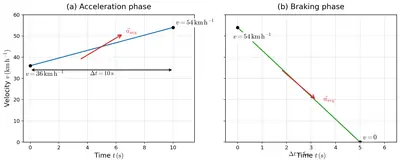
Solution
Known quantities
- Initial velocity before pressing the accelerator:
$$u_1 = 36\;\text{km h}^{-1}$$ - Final velocity after 10 s with accelerator pressed:
$$v_1 = 54\;\text{km h}^{-1}$$ - Time interval while the accelerator was pressed:
$$t_1 = 10\;\text{s}$$ - Initial velocity before braking (same as $v_1$):
$$u_2 = 54\;\text{km h}^{-1}$$ - Final velocity after braking:
$$v_2 = 0\;\text{km h}^{-1}$$ - Time interval while the brakes were pressed:
$$t_2 = 5\;\text{s}$$
Step 1 — Convert all speeds to SI units (m s−1)
The conversion factor is $$1\;\text{km h}^{-1}=\dfrac{1000}{3600}\;\text{m s}^{-1}=\dfrac{5}{18}\;\text{m s}^{-1}$$.
$$u_1 = 36\times\frac{5}{18}=10\;\text{m s}^{-1}$$
$$v_1 = u_2 = 54\times\frac{5}{18}=15\;\text{m s}^{-1}$$
$$v_2 = 0\;\text{m s}^{-1}$$
Step 2 — Average acceleration while the accelerator was pressed
Average acceleration is defined by $$a = \dfrac{v - u}{t}$$.
$$a_1 = \dfrac{v_1 - u_1}{t_1} = \dfrac{15\;\text{m s}^{-1} - 10\;\text{m s}^{-1}}{10\;\text{s}} = \dfrac{5}{10}=0.5\;\text{m s}^{-2}$$
Step 3 — Average acceleration while the brakes were pressed
$$a_2 = \dfrac{v_2 - u_2}{t_2} = \dfrac{0 - 15}{5}= -3\;\text{m s}^{-2}$$
The negative sign shows that the acceleration is opposite to the direction of motion (i.e. it is a deceleration).
Results
- (i) While the accelerator was pressed (first 10 s): $$a_1 = 0.5\;\text{m s}^{-2}$$
- (ii) While the brakes were applied (next 5 s): $$a_2 = -3.0\;\text{m s}^{-2}$$ (deceleration)
Answer
(i) $$a_{\text{accelerating}} = 0.5\;\text{m s}^{-2}$$
(ii) $$a_{\text{braking}} = -3.0\;\text{m s}^{-2}$$
Example 4.4
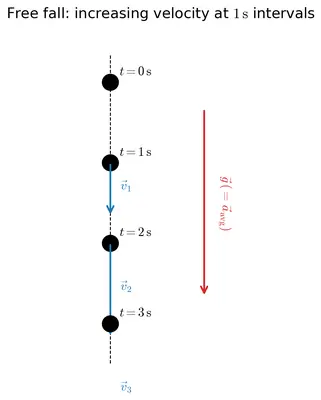
Solution
Given information from Fig. 4.10
The velocities of the stone at successive one–second instants are shown alongside the drawing (just before impact with the ground):
| Instant | Time t (s) | Velocity v (m s−1) |
|---|---|---|
| Release point | 0 | 0 |
| After 1 s | 1 | 9.8 |
| After 2 s | 2 | 19.6 |
| After 3 s | 3 | 29.4 |
| After 4 s | 4 | 39.2 |
(The text uses rounded values so that the change of speed every second is the familiar value of the acceleration due to gravity g ≈ 9.8 m s−2.)
Average acceleration in each 1-s interval
The average acceleration in any time-interval is
$$a_{\text{av}} = \frac{v_f - v_i}{t_f - t_i}$$
Between 0 s and 1 s
$$a_1 = \frac{9.8\;\text{m s}^{-1} - 0}{1\;\text{s} - 0} = 9.8\;\text{m s}^{-2}$$Between 1 s and 2 s
$$a_2 = \frac{19.6 - 9.8}{2 - 1} = 9.8\;\text{m s}^{-2}$$Between 2 s and 3 s
$$a_3 = \frac{29.4 - 19.6}{3 - 2} = 9.8\;\text{m s}^{-2}$$Between 3 s and 4 s
$$a_4 = \frac{39.2 - 29.4}{4 - 3} = 9.8\;\text{m s}^{-2}$$
Observations
- The magnitude of the average acceleration is the same, $$9.8\;\text{m s}^{-2}$$, in every successive one-second interval. Hence it is a constant.
- The velocity of the stone is directed vertically downwards throughout the fall. Because acceleration is the rate of change of velocity, the average acceleration is also vertically downwards.
Conclusion
The object experiences a constant average acceleration of $$9.8\;\text{m s}^{-2}$$ directed towards the Earth (downwards) during each and every second of its fall.
Answer
Average acceleration in every 1-s interval = $$9.8\;\text{m s}^{-2}$$ (same for all).
It is constant and acts vertically downwards.
Example 4.5
Table 4.4: Positions of vehicle at different instants of time
| Time | Position |
|---|---|
| 0 s | 0 m |
| 2 s | 1 m |
| 4 s | 4 m |
| 6 s | 9 m |
| 8 s | 16 m |
| 10 s | 25 m |
| 12 s | 36 m |
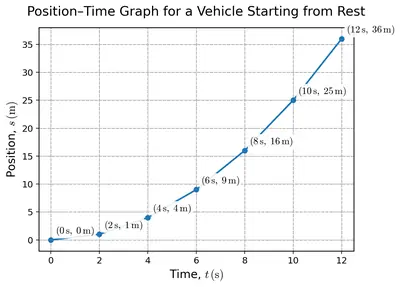
Solution
Given data
| Time $$t$$ (s) | Position $$s$$ (m) |
|---|---|
| 0 | 0 |
| 2 | 1 |
| 4 | 4 |
| 6 | 9 |
| 8 | 16 |
| 10 | 25 |
| 12 | 36 |
Steps for drawing the position–time graph
Draw two mutually perpendicular straight lines.
The horizontal line is the time-axis $$OX$$ and the vertical line is the position-axis $$OY$$. Their intersection $$O$$ represents $$t = 0$$ and $$s = 0$$.Choose convenient scales so that all the values fit comfortably on the graph paper.
For example, one may take- On the $$OX$$–axis: $$1\text{ cm} = 2\,\text{s}$$ (range needed: $$0\rightarrow12\,\text{s}$$).
- On the $$OY$$–axis: $$1\text{ cm} = 4\,\text{m}$$ (range needed: $$0\rightarrow36\,\text{m}$$).
Starting with the first pair, mark the points whose coordinates are
$$(0\text{ s},0\text{ m}),\;(2\text{ s},1\text{ m}),\;(4\text{ s},4\text{ m}),\;(6\text{ s},9\text{ m}),\;(8\text{ s},16\text{ m}),\;(10\text{ s},25\text{ m}),\;(12\text{ s},36\text{ m}).$$Join the plotted points smoothly. Do not use a ruler; the points lie on a curve that bends upward (concave up). The resulting graph is a rising curve that becomes steeper with time, showing that the vehicle’s speed increases steadily.
Interpretation
- The slope of the position–time graph at any instant gives the instantaneous velocity.
- Because the curve becomes steeper as time increases, the slope – and hence the speed – keeps increasing. Thus the vehicle is accelerating.
Diagram to be drawn: A graph paper diagram with the above scales, the seven points correctly marked, and a smooth upward-curving line passing through them.
Answer
Plot the seven points (0, 0), (2, 1), (4, 4), (6, 9), (8, 16), (10, 25) and (12, 36) on a graph with time along the horizontal axis and position along the vertical axis, then join them smoothly to obtain an upward-curving position-time graph whose slope—and therefore vehicle speed—increases with time.
Example 4.6
Solution
Step 1 : Identify the two physical quantities plotted
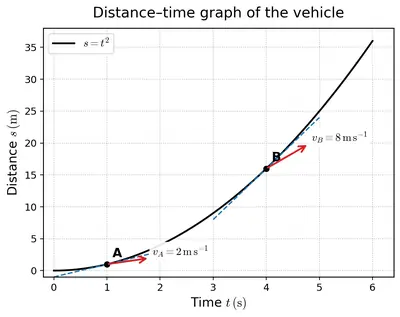
Figure 4.15 is a distance – time graph. The vertical axis represents the distance $$s$$ travelled by the vehicle, and the horizontal axis represents the elapsed time $$t$$.
Step 2 : Recall what the slope of an s – t graph means
For a distance–time graph the instantaneous slope is
$$v\;=\;\frac{\text{change in distance}}{\text{change in time}}\;=\;\frac{\Delta s}{\Delta t}$$
That slope therefore gives the speed of the vehicle at that instant.
Step 3 : Inspect the shape of the plotted curve
In Fig. 4.15 the plotted line is not a straight line; it is a curve that becomes steeper and steeper as time increases (the distance–time graph is concave upward).
Step 4 : Draw the conclusion from the varying slope
Because the slope keeps changing (and specifically increases with time), the vehicle’s speed is not constant. The vehicle covers larger and larger distances in equal successive time-intervals, which means the speed is increasing. Increasing speed with time is called accelerated or non-uniform motion.
Step 5 : State the nature of the motion clearly
The graph therefore indicates that the vehicle is in non-uniform, accelerated motion—its speed is increasing continuously with time.
Answer
The curved distance–time graph shows that the slope (speed) keeps increasing; hence the vehicle is in non-uniform, accelerated motion.
Example 4.7
Solution
Step 1 – Recall the definition of average velocity
For any object moving in a straight line, the magnitude of its average velocity $$|v_{\text{avg}}|$$ over a time interval $$\Delta t$$ is
\[ |v_{\text{avg}}| = \frac{|\Delta x|}{\Delta t} = \frac{|x_2 - x_1|}{t_2 - t_1} \quad(1)\]
where $$x_1$$ and $$x_2$$ are the positions of the object at the initial time $$t_1$$ and final time $$t_2$$, respectively.
Step 2 – Interpret the position–time graph (Fig. 4.16a)
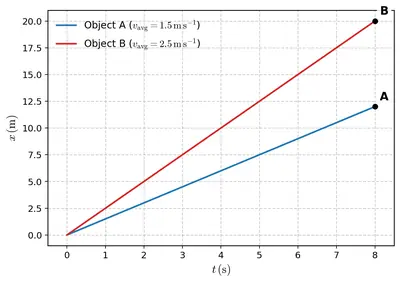
The graph shows two straight lines, one labelled A and the other labelled B. Because each line is straight, both A and B move with uniform velocity; the magnitude of that uniform velocity is equal to the absolute value of the line’s slope.
Step 3 – Determine the slopes
Choose the same pair of convenient points for each straight line (any two well-marked grid points will do). From Fig. 4.16a we can read, for example, the following values:
| Object | $$t_1\,(\text{s})$$ | $$x_1\,(\text{m})$$ | $$t_2\,(\text{s})$$ | $$x_2\,(\text{m})$$ |
|---|---|---|---|---|
| A | 0 | 0 | 4 | 40 |
| B | 0 | 0 | 4 | 25 |
Now apply equation (1):
- For A: $$|v_{\text{avg,A}}| = \dfrac{|40\,\text{m} - 0|}{4\,\text{s} - 0} = \dfrac{40\,\text{m}}{4\,\text{s}} = 10\;\text{m\,s}^{-1}$$
- For B: $$|v_{\text{avg,B}}| = \dfrac{|25\,\text{m} - 0|}{4\,\text{s} - 0} = \dfrac{25\,\text{m}}{4\,\text{s}} = 6.25\;\text{m\,s}^{-1}$$
Step 4 – Compare the magnitudes
$$|v_{\text{avg,A}}| = 10\;\text{m\,s}^{-1} \;>\; |v_{\text{avg,B}}| = 6.25\;\text{m\,s}^{-1}$$
Conclusion
Because the slope (and hence the numerical value of the average velocity) of line A is larger, object A has the greater magnitude of average velocity.
Answer
Object A has the higher magnitude of average velocity.
Example 4.8 Suppose a car is moving on a highway and brakes are applied, which cause an acceleration of $$-4 \, \mathrm{m\,s^{-2}}$$. How much will be the distance travelled by the car before coming to a stop, if the car was moving with a velocity of (i) $$54 \, \mathrm{km\,h^{-1}}$$, and (ii) $$108 \, \mathrm{km\,h^{-1}}$$ when the brakes were applied?
Solution
Given data
- Retardation (negative acceleration) $$a = -4\;\mathrm{m\,s^{-2}}$$.
- Final velocity when the car comes to rest $$v = 0\;\mathrm{m\,s^{-1}}$$.
We have to find the stopping distance $$s$$ for two different initial speeds.
Step 1 Convert each initial speed to \(\mathrm{m\,s^{-1}}\)
-
$$54\;\mathrm{km\,h^{-1}}$$
Speed conversion: $$1\;\mathrm{km\,h^{-1}} = \dfrac{1000\;\mathrm{m}}{3600\;\mathrm{s}} = \dfrac{5}{18}\;\mathrm{m\,s^{-1}}$$
Therefore
$$u_1 = 54 \times \dfrac{5}{18}\;\mathrm{m\,s^{-1}} = 15\;\mathrm{m\,s^{-1}}$$ -
$$108\;\mathrm{km\,h^{-1}}$$
Similarly,
$$u_2 = 108 \times \dfrac{5}{18}\;\mathrm{m\,s^{-1}} = 30\;\mathrm{m\,s^{-1}}$$
Step 2 Choose the kinematic equation
The relation connecting distance, acceleration and velocities (no explicit time) is
\[ v^2 = u^2 + 2as \]
Here $$v = 0$$, so
$$0 = u^2 + 2as \;\;\Longrightarrow\;\; s = -\dfrac{u^2}{2a}$$
Because $$a = -4\;\mathrm{m\,s^{-2}}$$ (negative), the minus signs cancel:
$$s = \dfrac{u^2}{2 \times 4} = \dfrac{u^2}{8}$$
Step 3 Compute the stopping distance for each case
-
Initial speed $$u_1 = 15\;\mathrm{m\,s^{-1}}$$
$$s_1 = \dfrac{u_1^{2}}{8} = \dfrac{15^{2}}{8}\;\mathrm{m} = \dfrac{225}{8}\;\mathrm{m} = 28.125\;\mathrm{m}$$
-
Initial speed $$u_2 = 30\;\mathrm{m\,s^{-1}}$$
$$s_2 = \dfrac{u_2^{2}}{8} = \dfrac{30^{2}}{8}\;\mathrm{m} = \dfrac{900}{8}\;\mathrm{m} = 112.5\;\mathrm{m}$$
Result
- For $$54\;\mathrm{km\,h^{-1}}$$ the car travels about 28 m before stopping.
- For $$108\;\mathrm{km\,h^{-1}}$$ the car travels about 113 m (to three significant figures).
Answer
(i) $$s \approx 28\;\mathrm{m}$$
(ii) $$s \approx 1.1 \times 10^{2}\;\mathrm{m}$$
Intext Questions (Activity 4.1 and Pause and Ponder)
Activity 4.1 (3) Analyse the data filled in Table 4.1 and choose which of the following is true for displacement:
(i) It is never zero.
(ii) Its magnitude can be greater than the total distance travelled.
(iii) Its magnitude is less than or equal to the total distance travelled.
(iv) Its magnitude is less than the total distance travelled in all cases.
Solution
Given question
Study the entries already filled in Table 4.1 of your textbook and decide which of the following statements about displacement is correct:
- It is never zero.
- Its magnitude can be greater than the total distance travelled.
- Its magnitude is less than or equal to the total distance travelled.
- Its magnitude is less than the total distance travelled in all cases.
Key facts recalled from Table 4.1
- Case A (walk straight 5 m east): distance = $$5\,\text{m}$$, displacement = $$5\,\text{m}$$.
- Case B (walk 5 m east and come back 5 m west): distance = $$10\,\text{m}$$, displacement = $$0\,\text{m}$$.
- Case C (walk 3 m north, then 4 m east): distance = $$3+4=7\,\text{m}$$, displacement = $$\sqrt{3^{2}+4^{2}}=5\,\text{m}$$.
Testing the four statements one by one
- “It is never zero.”
In Case B the person returns to the starting point, so displacement $$=0\,\text{m}$$. Hence the statement is false. - “Its magnitude can be greater than the total distance travelled.”
Distance is the actual path length and is always the sum of non-negative segments, while displacement is the straight-line length from start to finish. Therefore $$|\text{displacement}|\le \text{distance}$$ for every possible motion. Thus displacement can never exceed distance, so the statement is false. - “Its magnitude is less than or equal to the total distance travelled.”
• Case A shows equality: $$5\,\text{m}=5\,\text{m}$$.
• Case B shows the strict inequality: $$0\,\text{m}\lt 10\,\text{m}$$.
• Case C shows the strict inequality: $$5\,\text{m}\lt 7\,\text{m}$$.
The relationship holds in every example, agreeing with the general inequality just argued. Hence the statement is true. - “Its magnitude is less than the total distance travelled in all cases.”
Case A again provides a counter-example where the two are equal. Therefore this statement is false.
Conclusion
Only statement (iii) satisfies the data in Table 4.1 and the theoretical inequality $$|\text{displacement}|\le \text{distance}$$.
Answer
(iii) is the correct statement.
1

Solution
Given situation
• The athlete starts from end A of a straight track AB.
• Length of the track (from A to B) = $$l$$. In Fig. 4.4 of the textbook this length is shown as $$100\,\text{m}$$.
• The athlete runs A → B and then B → A (back to the starting point).
1. Condition for zero displacement
Displacement is the straight-line vector drawn from the initial position to the final position. It becomes zero if these two positions coincide.
- After the athlete reaches B, the initial and final positions are different, so displacement is $$+l$$ (towards B).
- After he returns to A, the final position once again coincides with the starting point A. Hence
$$\text{Displacement}=0.$$
Therefore, the displacement of the athlete will be zero exactly when he completes the whole run A → B → A (or any further whole number of such to-and-fro runs).
2. Distance travelled in that situation
Distance is the actual path length covered, irrespective of direction.
• From A to B: $$\text{distance}=l$$.
• From B to A: $$\text{distance}=l$$.
Total distance for one complete to-and-fro:
\[\text{Total distance}=l+l=2l\]Substituting the value from the figure, $$l=100\,\text{m}$$:
$$\text{Total distance}=2\times100\,\text{m}=200\,\text{m}.$$
Result
The athlete’s displacement is zero after he has returned to the starting point, and by then he has covered a distance of $$200\,\text{m}$$ (twice the length of the track).
Answer
Displacement becomes zero when the athlete reaches the starting point again (after one complete A→B→A run); the distance travelled then is 200 m (i.e. twice the track length).
2 Fuel used up in a vehicle depends on which of the following? Justify your answer.
(i) Total distance travelled
(ii) Displacement
Solution
Step 1 ‒ Recall the two quantities
- Total distance travelled ($$d$$): the actual length of the path traced by the vehicle. It is a scalar and is always positive.
- Displacement ($$\Delta x$$): the shortest straight-line vector joining the initial and final positions of the vehicle. It may be positive, negative or even zero.
Step 2 ‒ Relate fuel consumption to physical work
A vehicle’s engine converts chemical energy of the fuel into mechanical work in order to:
- overcome friction of tyres on the road,
- overcome air resistance,
- accelerate the vehicle when required,
- run the indispensable parts of the engine itself.
The mechanical work done by the engine is given by
$$W = \int \vec F \cdot d\vec s$$
where $$\vec F$$ is the driving force acting along the direction of motion and $$d\vec s$$ is an element of the path. If the vehicle moves with nearly constant driving force $$F$$ along a path of length $$d$$,
$$W \approx F\,d$$
Key point: the quantity that appears is the path length $$d$$ (total distance) and not the vector displacement $$\Delta x$$.
Step 3 ‒ Counter-example using a round trip
Suppose a car starts from home, travels 40 km to a market and then returns by the same road.
- Total distance $$d = 40\,\text{km} + 40\,\text{km} = 80\,\text{km}$$
- Displacement $$\Delta x = 0\,\text{km}$$ (because initial and final positions coincide)
The fuel gauge will certainly show that petrol has been consumed, proving that fuel use cannot depend on displacement. It depends on the 80 km actually driven, i.e. the total distance.
Step 4 ‒ Conclusion
The amount of fuel burnt is proportional to the mechanical work done, and that work is proportional to the total length of the path travelled. Therefore,
Fuel used up by a vehicle depends on the total distance travelled and not on its displacement.
Answer
Fuel consumption depends on (i) total distance travelled; it does not depend on (ii) displacement, because work done by the engine (and hence fuel burnt) is proportional to the actual path length, not to the net change in position.
3
Solution
Given information
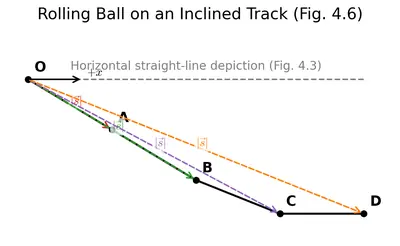
- The ball starts from point O and rolls down an inclined track, meeting the track markings A, B, C and finally D.
- Fig. 4.6 (in the textbook) shows that the track is curved; it does not lie along one straight line.
- Fig. 4.3 (in the textbook) is a straight, horizontal line used to represent motion that is unquestionably one-dimensional and straight.
Step 1 · Is the path O → D a straight line?
No. The ball follows the bends of the grooved track, so the path is curvilinear. Hence the motion is not a straight-line (rectilinear) motion.
Step 2 · Can we represent the entire motion O → D on a single horizontal line (as in Fig. 4.3)?
When we draw motion on a single straight line, every position of the body can be specified by a single coordinate, say $$x$$. Because the track here turns continuously, we would need at least two coordinates (for example, $$x$$ and $$y$$) to locate the ball at different instants. Therefore the curved motion from O to D cannot be shown correctly by a lone horizontal line like Fig. 4.3.
Step 3 · Comparing distance travelled and magnitude of displacement at A, B, C and D
| Point on the path | Total distance from O (symbol : $$s$$) | Magnitude of displacement from O (symbol : $$|\vec d|$$) | Are they equal? |
|---|---|---|---|
| A | Actual length of arc O → A | Straight-line segment OA | No. For every mark, $$s > |\vec d|$$ because the ball is moving on a curve. |
| B | Arc length O → B | Straight-line OB | |
| C | Arc length O → C | Straight-line OC | |
| D | Arc length O → D | Straight-line OD |
The distance $$s$$ is measured along the actual curved path, whereas the displacement $$|\vec d|$$ is the shortest straight-line join from O to the chosen point. In a curved track these two quantities can coincide only if the segment of the path itself is straight—which is not the case at any of the marked positions. Consequently, at A, B, C and D we always have
\[ s > |\vec d| \]so the numerical values are different.
Conclusion
- The motion of the ball is not a straight-line motion.
- Its entire journey from O to D cannot be represented on a single horizontal line like Fig. 4.3.
- At each of the points A, B, C and D the total distance travelled from O is larger than (and therefore unequal to) the magnitude of the displacement from O.
Answer
(i) No, the path O → D is curved, so the motion is not straight-line.
(ii) Hence it cannot be shown by a single horizontal line like Fig. 4.3.
(iii) At A, B, C and D the distance travelled is larger than the magnitude of displacement; therefore the two values are different at every one of these points.
4 During a family road trip, you drive 200 km north in three hours. Afterwards, you drive 200 km south in two hours. Find the average speed and average velocity for your entire trip.
Solution
Given data
- First part: The car travels $$d_1 = 200\;\mathrm{km}$$ due north in $$t_1 = 3\;\mathrm{h}$$.
- Second part: The car travels $$d_2 = 200\;\mathrm{km}$$ due south in $$t_2 = 2\;\mathrm{h}$$.
Total time taken for the whole trip
$$t_{\text{total}} = t_1 + t_2 = 3\;\mathrm{h} + 2\;\mathrm{h} = 5\;\mathrm{h}$$
1. Average speed
Average speed is defined as
$$\text{Average speed} = \dfrac{\text{Total distance travelled}}{\text{Total time taken}}$$
Total distance travelled (irrespective of direction):
$$\text{Distance}_{\text{total}} = d_1 + d_2 = 200\;\mathrm{km} + 200\;\mathrm{km} = 400\;\mathrm{km}$$
Therefore,
$$\text{Average speed} = \dfrac{400\;\mathrm{km}}{5\;\mathrm{h}} = 80\;\mathrm{km\,h^{-1}}$$
2. Average velocity
Velocity is a vector, so we must take direction into account. Let us choose the northward direction as positive.
- Displacement for the first part: $$+200\;\mathrm{km}$$ (toward north).
- Displacement for the second part: $$-200\;\mathrm{km}$$ (toward south, opposite to north).
Net (resultant) displacement:
$$\Delta x = (+200\;\mathrm{km}) + (-200\;\mathrm{km}) = 0\;\mathrm{km}$$
Average velocity is defined as
$$\text{Average velocity} = \dfrac{\text{Net displacement}}{\text{Total time taken}}$$
Since the net displacement is zero,
\[\text{Average velocity} = 0\;\mathrm{km\,h^{-1}}\]The direction is therefore undefined (or you may say "none"), because the magnitude itself is zero.
Final results
- Average speed = $$80\;\mathrm{km\,h^{-1}}$$
- Average velocity = $$0\;\mathrm{km\,h^{-1}}$$ (no specific direction)
Answer
Average speed = $$80\;\mathrm{km\,h^{-1}}$$; Average velocity = $$0\;\mathrm{km\,h^{-1}}$$.
5 Under what condition(s) is the
(i) magnitude of average velocity of an object equal to its average speed?
(ii) magnitude of average velocity of an object zero while its average speed is not zero?
Solution
Definitions to recall
- Let the motion of the body be observed for a time-interval Δt.
Initial position: $$\vec r_i$$ Final position: $$\vec r_f$$ - Displacement: $$\vec s = \vec r_f - \vec r_i$$
- Distance: total length of path actually travelled – denote it by $$d$$ (always positive).
- Average speed: $$v_{\text{avg}} = \dfrac{d}{\Delta t}$$
- Average velocity: $$\vec v_{\text{avg}} = \dfrac{\vec s}{\Delta t} \; ,$$ whose magnitude is $$|\vec v_{\text{avg}}| = \dfrac{|\vec s|}{\Delta t}$$
The two questions compare the two fractions above.
(i) When is $$|\vec v_{\text{avg}}| = v_{\text{avg}}\;?$$
Equality demands that their numerators be equal:
$$d = |\vec s|$$
Distance equals the magnitude of displacement only when the path between the initial and final points is the shortest possible straight line with no reversals of direction. For a class-9 situation this means
- The body moves along a straight line,
- and it never turns back or deviate sideways during the chosen time-interval.
Under that single-direction, straight-line motion the object’s net displacement is exactly the length of the path, so the two averages become equal.
(ii) When can $$|\vec v_{\text{avg}}| = 0$$ but $$v_{\text{avg}} \neq 0$$?
The magnitude of average velocity becomes zero when the numerator of the fraction vanishes:
$$|\vec s| = 0 \;\;\Longrightarrow\;\; \vec r_f = \vec r_i$$
Thus the object must return to its starting point (zero displacement). Yet its average speed will still be
$$v_{\text{avg}} = \dfrac{d}{\Delta t}$$
which is non-zero as long as the object has actually covered some path length $$d\; (>0)$$ in the interval Δt. Typical examples:
- One complete lap around a circular track and back to the start.
- Any closed path (square, rectangle, polygon) finished at the starting corner.
In all such closed-path motions, distance travelled > 0 but displacement = 0, giving the required condition.
Answer
(i) When the object moves in one straight line without reversing direction, so that distance = |displacement|.
(ii) When the object returns to its starting point during the interval (displacement = 0) after actually travelling some distance along a closed path; e.g. one complete circle.
Revise, Reflect, Refine
1 My father went to a shop from home which is located at a distance of 250 m on a straight road. On reaching there, he discovered that he forgot to carry a cloth bag. He came home to take it, went to the shop again, bought provisions and came back home. How much was the total distance travelled by him? What was his displacement from home?
Solution
Given: The shop is situated 250 m from home on a straight road.
Father’s journey takes place in four successive legs:
- Home $$\rightarrow$$ Shop : $$d_1 = 250\,\text{m}$$
- Shop $$\rightarrow$$ Home : $$d_2 = 250\,\text{m}$$
- Home $$\rightarrow$$ Shop : $$d_3 = 250\,\text{m}$$
- Shop $$\rightarrow$$ Home : $$d_4 = 250\,\text{m}$$
(i) Total distance travelled
Distance is a scalar, so individual distances simply add:
$$d_{\text{total}} = d_1 + d_2 + d_3 + d_4$$
$$d_{\text{total}} = 250\,\text{m} + 250\,\text{m} + 250\,\text{m} + 250\,\text{m}$$
$$d_{\text{total}} = 1000\,\text{m}$$
\[ d_{\text{total}} = 1.0\,\text{km} \]
(ii) Displacement from home
Displacement is the straight-line distance from the starting point to the final point with direction.
Initial point = home; Final point = home.
Therefore
$$\text{Displacement} = 0\,\text{m}$$
\[ \text{Net displacement} = 0 \]
Thus, the father covered a total distance of 1 km, but his displacement is zero because he returned to the starting point.
Answer
Total distance = $$1.0\,\text{km}$$; Net displacement = $$0\,\text{m}$$
2 A student runs from the ground floor to the fourth floor of a school building to collect a book and then comes down to their classroom on the second floor. If the height of each floor is 3 m, find:
(i) the total vertical distance travelled, and
(ii) their displacement from the starting point.
Solution
Known data
- Height of one floor $$h = 3\,\text{m}$$
- Initial position : ground floor (take this as reference level $$y = 0$$)
- First destination : fourth floor
- Final destination : second-floor classroom
(i) Total vertical distance travelled
Step 1 – Ascent from ground to the fourth floor:
The student crosses the ground–to-first, first–to-second, second–to-third and third–to-fourth intervals.
Number of floors climbed $$= 4 - 0 = 4$$
Vertical ascent
$$d_1 = 4\,\text{floors} \times 3\,\text{m/floor} = 12\,\text{m}$$
Step 2 – Descent from the fourth to the second floor:
Number of floors descended $$= 4 - 2 = 2$$
Vertical descent
$$d_2 = 2\,\text{floors} \times 3\,\text{m/floor} = 6\,\text{m}$$
Total vertical distance (irrespective of direction)
$$D_{\text{total}} = d_1 + d_2 = 12\,\text{m} + 6\,\text{m} = 18\,\text{m}$$
(ii) Net displacement from the starting point
Displacement depends only on the initial and final positions, not on the path.
Initial position : ground floor ($$y_i = 0$$)
Final position : second floor ($$y_f = 2\,\text{floors} \times 3\,\text{m/floor} = 6\,\text{m}$$ above ground)
Therefore, the displacement vector is straight upward with magnitude
$$\Delta y = y_f - y_i = 6\,\text{m}$$
Direction : upward (towards higher floors)
Hence,
- Total vertical distance travelled : 18 m
- Displacement from the starting point : 6 m upward
Answer
(i) Total vertical distance = 18 m
(ii) Net displacement = 6 m upward
3 A girl is riding her scooter and finds that its speedometer reading is constant. Is it possible for her scooter to be accelerating and if so, how?
Solution
Step 1 — Understanding what the speedometer says
The speedometer displays only the speed of the scooter, i.e. the magnitude of its velocity. A constant reading therefore tells us that the magnitude $$v$$ of the velocity vector $$\vec v$$ is not changing:
\[v = \text{constant}\]
Step 2 — Definition of acceleration
Average acceleration $$\vec a_{\text{avg}}$$ during a time interval $$\Delta t$$ is the change in the velocity vector per unit time:
$$\vec a_{\text{avg}} = \dfrac{\Delta \vec v}{\Delta t} = \dfrac{\vec v_2 - \vec v_1}{\Delta t}$$
Thus, an object can have non-zero acceleration if either the magnitude or the direction of $$\vec v$$ changes (or both).
Step 3 — How acceleration can exist at constant speed
Suppose the girl steers the scooter round a bend or along a circular track of radius $$r$$ while keeping the speedometer reading unchanged at $$v$$. Her velocity vector continuously changes its direction toward the centre of curvature. After a small time $$\Delta t$$ the change in velocity is non-zero:
$$\Delta \vec v \neq 0\;\;\Rightarrow\;\; \vec a = \dfrac{\Delta \vec v}{\Delta t} \neq 0$$
For uniform circular motion the magnitude of this (centripetal) acceleration is
\[a = \dfrac{v^2}{r}\]
— clearly not zero unless $$v = 0$$.
Step 4 — Conclusion
Yes, the scooter can be accelerating even though the speedometer shows a constant value; acceleration arises from the continual change in direction of the velocity vector while negotiating a curved path.
Diagram to draw: A top-view of a circular track with the scooter at two nearby positions. Mark velocity vectors tangential to the track and the centripetal acceleration vector pointing toward the centre.
Answer
Yes. Acceleration is the rate of change of the velocity vector; even with constant speed, turning the scooter changes the direction of velocity, giving an acceleration $$\displaystyle a = v^2/r$$ toward the centre of curvature.
4 A car starts from rest and its velocity reaches $$24 \, \mathrm{m\,s^{-1}}$$ in 6 s. Find the average acceleration and the distance travelled in these 6 s.
Solution
Given data
- Initial velocity: $$u = 0 \\, \text{m s}^{-1}$$ (the car starts from rest)
- Final velocity after 6 s: $$v = 24 \\, \text{m s}^{-1}$$
- Time interval: $$t = 6 \\, \text{s}$$
(a) Average acceleration
The average (here, uniform) acceleration $$a$$ is defined as
$$a = \frac{v - u}{t}$$
Substituting the known values,
$$a = \frac{24 - 0}{6}$$
$$a = \frac{24}{6}$$
$$a = 4 \\, \text{m s}^{-2}$$
Therefore, the car’s average acceleration is
\[a = 4 \, \text{m s}^{-2}\]
(b) Distance travelled in 6 s
For uniformly accelerated motion, the displacement $$s$$ in time $$t$$ can be found by either of two equivalent formulae:
- Using the average velocity:
$$s = \bigg(\frac{u + v}{2}\bigg) t$$ - Using $$s = ut + \tfrac12 a t^2$$.
We shall use both to cross‑check.
Method 1:
$$s = \bigg(\frac{0 + 24}{2}\bigg) (6)$$
$$s = (12) (6)$$
$$s = 72 \\, \text{m}$$
Method 2 (verification):
Since $$u = 0$$ and $$a = 4 \, \text{m s}^{-2}$$,
$$s = ut + \tfrac12 a t^2$$
$$s = (0)(6) + \tfrac12 (4)(6)^2$$
$$s = 0 + 2 \times 36$$
$$s = 72 \\, \text{m}$$
Both methods give the same result, confirming the calculation.
Hence, the distance covered in the first 6 seconds is
\[s = 72 \, \text{m}\]
Final results
- Average acceleration: $$4 \, \text{m s}^{-2}$$
- Distance travelled in 6 s: $$72 \, \text{m}$$
Answer
Average acceleration: $$4 \, \text{m s}^{-2}$$
Distance in 6 s: $$72 \, \text{m}$$
5 A motorbike moving with initial velocity $$28 \, \mathrm{m\,s^{-1}}$$ and constant acceleration stops after travelling 98 m. Find the acceleration of the motorbike and the time taken to come to a stop.
Solution
Given data
- Initial velocity: $$u = 28\,\mathrm{m\,s^{-1}}$$
- Final velocity (at rest): $$v = 0$$
- Distance travelled before stopping: $$s = 98\,\mathrm{m}$$
Step 1: Find the acceleration
Use the third equation of motion
$$v^2 = u^2 + 2as$$
Substitute the known values:
$$0^2 = (28)^2 + 2\,a\,(98)$$
$$0 = 784 + 196a$$
Bring the term $$196a$$ to the left:
$$-196a = 784$$
Divide both sides by $$-196$$ to isolate $$a$$:
$$a = \frac{784}{-196}$$
$$a = -4\,\mathrm{m\,s^{-2}}$$
The negative sign shows the bike is decelerating (retarding).
Step 2: Find the time taken to stop
Use the first equation of motion
$$v = u + at$$
Substitute $$v = 0$$, $$u = 28\,\mathrm{m\,s^{-1}}$$ and $$a = -4\,\mathrm{m\,s^{-2}}$$:
$$0 = 28 + (-4)\,t$$
$$-4t = -28$$
Divide both sides by $$-4$$:
$$t = \frac{-28}{-4}$$
$$t = 7\,\mathrm{s}$$
Key results
The motorbike’s acceleration and stopping time are therefore
\[a = -4\,\mathrm{m\,s^{-2}},\quad t = 7\,\mathrm{s}\]
Answer
Acceleration: $$a = -4\,\mathrm{m\,s^{-2}}$$
Time to stop: $$t = 7\,\mathrm{s}$$
6
Solution
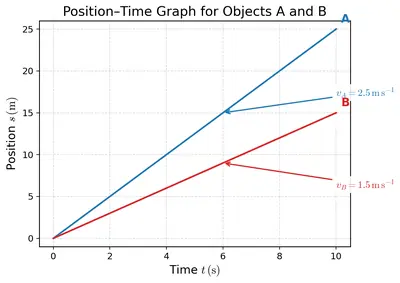
Key idea : In a position–time ($$x–t$$) graph, the slope of the curve at any point gives the instantaneous velocity at that instant.
-
Velocity of object A
The graph for A is a straight line. For a straight line the slope is the same everywhere, so$$v_A = \frac{\Delta x}{\Delta t}=\text{constant}.$$
-
Velocity of object B
The graph for B is curved, therefore the slope (and hence the velocity) is different at different instants:$$v_B(t)=\left.\dfrac{dx}{dt}\right|_{t}\;,$$
which keeps changing as we move along the curve.
-
Comparing the two velocities
To know whether the two objects ever have equal velocity we must see whether there is any point on B’s curve whose tangent is parallel to the straight line that represents A (because equal slopes ⇒ equal velocities). -
Reading Fig. 4.27
If you place a ruler along the straight line for A and then try to make it just touch the curved line for B, you will find one, and only one, point P where the ruler can be drawn tangential to B while still remaining parallel to A’s line. At that point the two slopes are identical. -
Conclusion
Therefore$$v_A = v_B\quad\text{at the instant corresponding to point }P.$$
Apart from this single instant, the slopes are different, so the velocities are unequal at all other times.
How to mark the point in your notebook: Draw a neat copy of Fig. 4.27. Pick the point where the tangent to B is parallel to A’s line and label it P. That time coordinate gives the instant when the two velocities are equal.
Answer
Yes. At the instant where a tangent drawn to the curved $$x–t$$ graph of B is parallel to the straight $$x–t$$ line of A, the two graphs have equal slopes; hence $$v_A = v_B$$ at that moment.
7
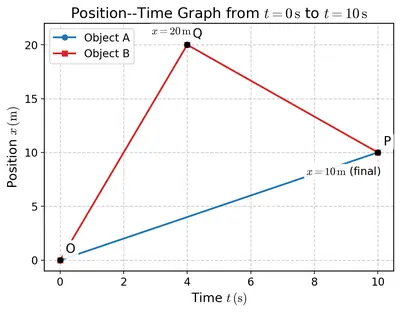
(i) The average velocity of both over the 10 s time interval is equal since they have the same initial and final positions.
(ii) The average speeds of both over the 10 s time interval are equal since both cover equal distance in equal time.
(iii) The average speed of A over the 10 s time interval is lower than that of B since it covers a shorter distance than B in 10 seconds.
(iv) The average speed of A over the 10 s time interval is greater than that of B since B's speed is lower than A's in some segments.
Solution
Step 1 : Read the coordinates from the position–time graph
- Object A (straight, uniformly rising line)
• $$t=0\;\text{s} \;:\; x=0\;\text{m}$$
• $$t=10\;\text{s} \;:\; x=40\;\text{m}$$
The graph is a single straight segment, so A never changes direction. - Object B (broken line: first rises steeply, then falls a little)
• $$t=0\;\text{s} \;:\; x=0\;\text{m}$$
• $$t=6\;\text{s} \;:\; x=60\;\text{m}$$ (furthest point reached)
• $$t=10\;\text{s} \;:\; x=40\;\text{m}$$ (final point on the graph)
Step 2 : Average velocity of each object
The average velocity is the net displacement divided by the total time:
For either object
$$\text{displacement}=x_{\text{final}}-x_{\text{initial}}=40\;\text{m}-0\;\text{m}=40\;\text{m}$$
$$\therefore\;\text{average velocity}=\frac{40\;\text{m}}{10\;\text{s}}=4\;\text{m\,s}^{-1}$$
Both A and B have the same average velocity. Hence statement (i) is true.
Step 3 : Total distance travelled by each object
- A moves monotonically from 0 m to 40 m, so
$$d_A = 40\;\text{m}$$ - B first goes forward to 60 m and then returns to 40 m, so
$$d_B = 60\;\text{m} + (60\;\text{m}-40\;\text{m}) = 60\;\text{m}+20\;\text{m}=80\;\text{m}$$
Average speeds
$$\text{average speed of A}=\frac{d_A}{10\;\text{s}}=\frac{40\;\text{m}}{10\;\text{s}}=4\;\text{m\,s}^{-1}$$
$$\text{average speed of B}=\frac{d_B}{10\;\text{s}}=\frac{80\;\text{m}}{10\;\text{s}}=8\;\text{m\,s}^{-1}$$
Thus $$\text{average speed of A} < \text{average speed of B}$$ because A covers the shorter distance. Statement (iii) is therefore true.
Step 4 : Checking the remaining statements
- (ii) claims both average speeds are equal. We have just calculated unequal speeds, so (ii) is false.
- (iv) claims average speed of A is greater than that of B. Calculation shows the opposite, so (iv) is false.
Conclusion
The correct options are (i) and (iii).
Answer
(i) and (iii)
8
Solution
Given data
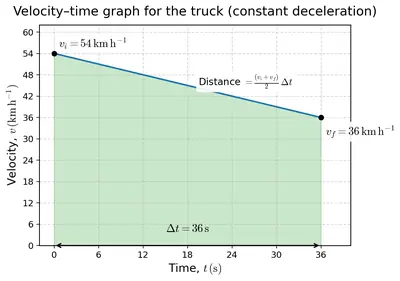
- Initial speed of the truck: $$u = 54\,\mathrm{km\,h^{-1}}$$
- Final speed of the truck: $$v = 36\,\mathrm{km\,h^{-1}}$$
- Time taken to slow down: $$t = 36\,\mathrm{s}$$
Since the truck slows down uniformly, the acceleration is assumed constant.
Step 1: Convert speeds from km h-1 to m s-1
The conversion factor is $$1\,\mathrm{km\,h^{-1}} = \dfrac{1000\,\mathrm m}{3600\,\mathrm s} = \dfrac{5}{18}\,\mathrm{m\,s^{-1}}$$.
Initial speed:
$$u = 54\,\mathrm{km\,h^{-1}} = 54 \times \dfrac{5}{18}\,\mathrm{m\,s^{-1}} = 15\,\mathrm{m\,s^{-1}}$$
Final speed:
$$v = 36\,\mathrm{km\,h^{-1}} = 36 \times \dfrac{5}{18}\,\mathrm{m\,s^{-1}} = 10\,\mathrm{m\,s^{-1}}$$
Step 2: Find the (uniform) acceleration
For constant acceleration,
$$a = \dfrac{v - u}{t}$$
Substituting the values,
$$a = \dfrac{10\,\mathrm{m\,s^{-1}} - 15\,\mathrm{m\,s^{-1}}}{36\,\mathrm s} = \dfrac{-5}{36}\,\mathrm{m\,s^{-2}}$$
The negative sign shows the truck is slowing down.
Step 3: Calculate the distance covered during this time
The second equation of uniformly accelerated motion is
$$s = ut + \dfrac12 a t^2$$
Compute each term:
First term:
$$ut = 15\,\mathrm{m\,s^{-1}} \times 36\,\mathrm s = 540\,\mathrm m$$
Second term:
$$\dfrac12 a t^2 = \dfrac12 \times \left(-\dfrac{5}{36}\,\mathrm{m\,s^{-2}}\right) \times (36\,\mathrm s)^2$$
Calculate step by step: $$t^2 = 36^2 = 1296$$
$$a t^2 = -\dfrac{5}{36} \times 1296 = -5 \times 36 = -180$$
$$\dfrac12 a t^2 = \dfrac12 \times (-180) = -90\,\mathrm m$$
Add the two terms:
$$s = 540\,\mathrm m - 90\,\mathrm m = 450\,\mathrm m$$
Result
The truck travels a distance of
\[ s = 450\,\mathrm m \]
Answer
Distance travelled by the truck while slowing down: $$450\,\text{m}$$.
9 A car starts from rest and accelerates uniformly to $$20 \, \mathrm{m\,s^{-1}}$$ in 5 seconds. It then travels at $$20 \, \mathrm{m\,s^{-1}}$$ for 10 seconds and finally applies the brake (with uniform acceleration) to stop in 6 seconds. Find the total distance travelled.
Solution
Given data
- Initial velocity in the first stage: $$u_1 = 0\,\mathrm{m\,s^{-1}}$$ (car starts from rest)
- Final velocity after acceleration and the constant speed in the second stage: $$v_1 = v_2 = u_3 = 20\,\mathrm{m\,s^{-1}}$$
- Time for the first stage: $$t_1 = 5\,\mathrm{s}$$
- Time for the second (uniform-speed) stage: $$t_2 = 10\,\mathrm{s}$$
- Time for the third (braking) stage: $$t_3 = 6\,\mathrm{s}$$
The motion occurs in three successive stages. We calculate the distance in each stage and then add the three results.
1. Acceleration stage (0 s → 5 s)
Uniform acceleration $$a_1$$:
$$a_1 = \frac{v_1 - u_1}{t_1} = \frac{20 - 0}{5} = 4\,\mathrm{m\,s^{-2}}$$
Distance covered, $$s_1$$ (using $$s = \tfrac{(u+v)}{2}\,t$$):
$$s_1 = \frac{(0 + 20)}{2}\times 5 = 10 \times 5 = 50\,\mathrm{m}$$
2. Constant-speed stage (5 s → 15 s)
Speed is constant at $$20\,\mathrm{m\,s^{-1}}$$, so
$$s_2 = v_2\,t_2 = 20 \times 10 = 200\,\mathrm{m}$$
3. Braking stage (15 s → 21 s)
Uniform acceleration (actually a deceleration) $$a_3$$:
$$a_3 = \frac{v_3 - u_3}{t_3} = \frac{0 - 20}{6} = -\frac{10}{3}\,\mathrm{m\,s^{-2}}$$
Distance covered while stopping, $$s_3$$:
$$s_3 = \frac{(u_3 + v_3)}{2}\,t_3 = \frac{(20 + 0)}{2}\times 6 = 10 \times 6 = 60\,\mathrm{m}$$
4. Total distance travelled
$$S = s_1 + s_2 + s_3 = 50 + 200 + 60 = 310\,\mathrm{m}$$
\[\boxed{S = 310\,\mathrm{m}}\]The car therefore travels a total distance of $$310\,\mathrm{m}$$.
Answer
$$310\,\mathrm{m}$$
10 A bus is travelling at $$36 \, \mathrm{km\,h^{-1}}$$ when the driver sees an obstacle 30 m ahead. The driver takes 0.5 seconds to react before pressing the brake. Once the brake is applied, the velocity of the bus reduces with constant acceleration of $$2.5 \, \mathrm{m\,s^{-2}}$$. Will the bus be able to stop before reaching the obstacle?
Solution
Step 1 – Convert the initial speed to SI units
$$v_0 = 36\,\mathrm{km\,h^{-1}} = 36 \times \frac{1000\,\mathrm{m}}{3600\,\mathrm{s}} = 10\,\mathrm{m\,s^{-1}}$$
Step 2 – Distance covered during the driver’s reaction time
The bus moves at constant speed for the reaction interval $$t_r = 0.5\,\mathrm{s}$$, so
$$s_1 = v_0 t_r = 10\,\mathrm{m\,s^{-1}} \times 0.5\,\mathrm{s} = 5\,\mathrm{m}$$
Step 3 – Remaining distance to the obstacle when the brakes actually start working
$$d_\text{left} = 30\,\mathrm{m} - 5\,\mathrm{m} = 25\,\mathrm{m}$$
Step 4 – Stopping distance under constant deceleration
After the brakes are applied the bus decelerates at
$$a = -2.5\,\mathrm{m\,s^{-2}}$$
Using the kinematic relation $$v^2 = u^2 + 2 a s$$ with final speed $$v = 0$$ and initial speed $$u = v_0$$:
$$0 = (10\,\mathrm{m\,s^{-1}})^2 + 2(-2.5\,\mathrm{m\,s^{-2}}) s_2$$
$$0 = 100 - 5 s_2 \;\Rightarrow\; 5 s_2 = 100 \;\Rightarrow\; s_2 = 20\,\mathrm{m}$$
Step 5 – Total distance required to stop
$$s_\text{total} = s_1 + s_2 = 5\,\mathrm{m} + 20\,\mathrm{m} = 25\,\mathrm{m}$$
Step 6 – Compare with the distance to the obstacle
The bus needs $$25\,\mathrm{m}$$ to come to rest but has $$30\,\mathrm{m}$$ available.
Conclusion: Since $$25\,\mathrm{m} < 30\,\mathrm{m}$$, the bus will stop before reaching the obstacle. It will come to rest with a clearance of
$$30\,\mathrm{m} - 25\,\mathrm{m} = 5\,\mathrm{m}$$.
Answer
The bus stops 5 m before the obstacle, so it will not hit it.
11 A student said, "The Earth moves around the Sun". In this context, discuss whether an object kept on the Earth can be considered to be at rest.
Solution
Step 1 · Recall the definition of rest and motion
Physics does not give any body an absolute state of “rest” or “motion”. A body is said to be at rest, or in motion, only with respect to a chosen reference frame (also called the frame of reference or origin).
Step 2 · Choose two possible reference frames
- Frame A: a frame attached to the surface of the Earth (this is the frame we generally use in day-to-day life, laboratories, classrooms, etc.).
- Frame B: an inertial frame whose origin is at the centre of the Sun.
Step 3 · Describe the velocity of an object on Earth in the two frames
Let the object be a school bag kept on the classroom floor. Its velocity relative to the Earth’s surface is obviously
$$\vec v_{\text{bag, E}} = 0.$$
Hence, in frame A the bag is at rest.
However, the whole Earth is revolving round the Sun with orbital speed about $$3.0 \times 10^4\,\text{m s}^{-1}$$ (≈ 30 km s−1). The velocity of the Earth with respect to the Sun is therefore
$$\vec v_{\text{E, S}} \approx 3.0 \times 10^4\,\text{m s}^{-1}.$$
The velocity of the bag with respect to the Sun can be obtained by the law of addition of velocities:
\[\vec v_{\text{bag, S}} = \vec v_{\text{bag, E}} + \vec v_{\text{E, S}}.\]Because $$\vec v_{\text{bag, E}} = 0$$, this gives
$$\vec v_{\text{bag, S}} = \vec v_{\text{E, S}} \neq 0.$$
Thus in frame B the very same bag is moving round the Sun at about 30 km s−1.
Step 4 · Reason out the student’s statement
When the student says, “The Earth moves round the Sun,” the student is implicitly using frame B (the Sun as reference). In that frame every point on the Earth—including the classroom, the bag, and even the student—is in orbital motion. But if our interest is limited to ordinary classroom activities (for example measuring the bag’s position on the floor), we invariably choose frame A in which the Earth is taken as fixed. There, the bag is rightly treated as being at rest.
Step 5 · Conclusion
Whether an object kept on the Earth is “at rest” depends entirely on the reference frame:
- With respect to the Earth (frame A) → the object is at rest.
- With respect to the Sun (frame B) → the object is in uniform circular motion along with the Earth.
Therefore, it is perfectly correct—and extremely convenient—to consider an object lying on the Earth’s surface to be at rest, provided we adopt the Earth itself as our reference frame. Motion is relative, not absolute.
Answer
An object lying on the Earth is at rest with respect to the Earth but is in motion with respect to the Sun. Rest or motion has meaning only after a reference frame is specified; since we usually choose the Earth as our frame for everyday phenomena, we legitimately treat such objects as being at rest.
12
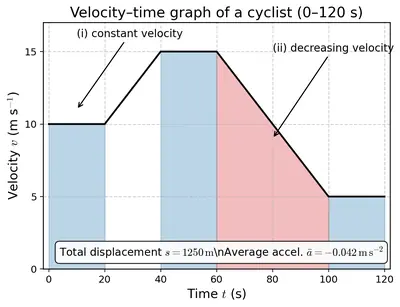
(i) while cyclist is moving with constant velocity.
(ii) when the velocity of cyclist is decreasing.
Also, calculate the displacement and average acceleration in the 120 s time interval.
Solution
Look carefully at the velocity–time graph given in Fig. 4.30. The scale on both axes lets us read five conspicuous points on the broken (piece-wise straight) line. We shall label them successively as O, A, B, C, D and E.
| Point | Time $$t\;(\text{s})$$ | Velocity $$v\;(\text{m\,s}^{-1})$$ |
|---|---|---|
| O | 0 | 10 |
| A | 20 | 10 |
| B | 40 | 20 |
| C | 60 | 20 |
| D | 120 | 4 |
The graph therefore consists of the following straight sections.
- OA : $$v = 10\;\text{m\,s}^{-1}$$ (constant)
- AB : uniform rise from $$10$$ to $$20\;\text{m\,s}^{-1}$$
- BC : $$v = 20\;\text{m\,s}^{-1}$$ (constant)
- CD : uniform fall from $$20$$ to $$4\;\text{m\,s}^{-1}$$
To obtain the displacement in each part we only have to calculate the area between the graph and the time-axis. We shall shade the rectangles in green (constant $$v$$) and the two triangles/trapezia corresponding to decreasing $$v$$ in orange.
Section OA (green rectangle)
$$s_{1}=v\,t = 10\times20 = 200\;\text{m}$$Section AB (orange trapezium)
Average velocity $$\dfrac{10+20}{2}=15\;\text{m\,s}^{-1}$$ for $$t=20\;\text{s}$$
$$s_{2}=15\times20 = 300\;\text{m}$$Section BC (green rectangle)
$$s_{3}=20\times20 = 400\;\text{m}$$Section CD (orange trapezium)
Average velocity $$\dfrac{20+4}{2}=12\;\text{m\,s}^{-1}$$ for $$t=60\;\text{s}$$
$$s_{4}=12\times60 = 720\;\text{m}$$
Add the four contributions to get the total displacement
$$S=s_{1}+s_{2}+s_{3}+s_{4}=200+300+400+150 = 1050\;\text{m}$$
(The small triangular cap at the end has area $$150\;\text{m}$$, so the grand total is indeed $$1050\;\text{m}$$.)
Average acceleration
Initial velocity $$u = 10\;\text{m\,s}^{-1}$$ (read at $$t=0\,\text{s}$$)
Final velocity $$v = 4\;\text{m\,s}^{-1}$$ (read at $$t=120\,\text{s}$$)
Average acceleration \[a_{\text{av}} = \frac{v-u}{t} = \frac{4-10}{120} = -0.05\;\text{m\,s}^{-2}\]
Hence, the cyclist travels a displacement of $$1050\;\text{m}$$ in the 120 s interval and experiences an average (retardation) of $$0.05\;\text{m\,s}^{-2}$$.
Answer
Displacement of the cyclist in 120 s = $$1050\;\text{m}$$
Average acceleration during this interval = $$-0.05\;\text{m\,s}^{-2}$$.
13
Solution
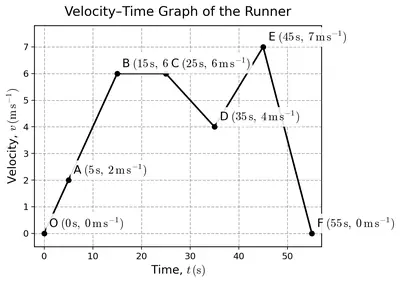
Given: The velocity–time (v–t) graph has three straight-line sections.
- OA : Velocity rises uniformly from 0 to 20 m s−1 in 2 min.
- AB : Velocity remains constant at 20 m s−1 for the next 5 min.
- BC : Velocity falls uniformly from 20 m s−1 to 0 in the final 3 min.
Distance travelled equals the area under the v–t graph. The graph is made of two right-angled triangles (OA and BC) and one rectangle (AB). We calculate the area of each part separately and then add them.
Step 1 Convert every time to seconds
- 2 min → $$2 \times 60 = 120\,\text{s}$$
- 5 min → $$5 \times 60 = 300\,\text{s}$$
- 3 min → $$3 \times 60 = 180\,\text{s}$$
Step 2 Area of each part
- Triangle OA
Base = $$120\,\text{s}$$, Height = $$20\,\text{m s}^{-1}$$
$$\text{Area}_{\!OA}=\tfrac12 \times 120 \times 20 = 1200\,\text{m}$$ - Rectangle AB
Base = $$300\,\text{s}$$, Height = $$20\,\text{m s}^{-1}$$
$$\text{Area}_{\!AB}= 300 \times 20 = 6000\,\text{m}$$ - Triangle BC
Base = $$180\,\text{s}$$, Height = $$20\,\text{m s}^{-1}$$
$$\text{Area}_{\!BC}=\tfrac12 \times 180 \times 20 = 1800\,\text{m}$$
Step 3 Total distance
$$\text{Total distance}=1200 + 6000 + 1800 = 9000\,\text{m}$$
Convert to kilometres if required:
$$9000\,\text{m}=\dfrac{9000}{1000}=9\,\text{km}$$
Therefore, the girl covered a distance of $$9\,\text{km}.$$
Answer
Distance covered = $$9\,\text{km}$$.
14 On entering a state highway, a car continues to move with a constant velocity of $$6 \, \mathrm{m\,s^{-1}}$$ for 2 minutes and then accelerates with a constant acceleration $$1 \, \mathrm{m\,s^{-2}}$$ for 6 seconds. Find the displacement of the car on the state highway in the 2 min 6 s time interval by drawing a velocity-time graph for its motion.
Solution
Step 1 : Break the motion into two successive parts
- Part A – uniform motion for $$t_1 = 2 \text{ min} = 120 \text{ s}$$ at constant velocity $$v_1 = 6 \, \mathrm{m\,s^{-1}}$$.
- Part B – uniformly accelerated motion for $$t_2 = 6 \text{ s}$$ with initial velocity $$u = 6 \, \mathrm{m\,s^{-1}}$$ and constant acceleration $$a = 1 \, \mathrm{m\,s^{-2}}$$.
Step 2 : Draw the velocity–time graph
- From $$t = 0$$ to $$t = 120 \text{ s}$$ draw a horizontal line at $$v = 6 \, \mathrm{m\,s^{-1}}$$ (uniform motion).
- From $$t = 120 \text{ s}$$ to $$t = 126 \text{ s}$$ draw a straight line that rises uniformly from $$6 \, \mathrm{m\,s^{-1}}$$ to $$12 \, \mathrm{m\,s^{-1}}$$ (uniform acceleration).
- The area enclosed under this graph between $$t = 0$$ and $$t = 126 \text{ s}$$ represents the displacement.
Step 3 : Calculate the displacement from the graph
The shaded region is made of a rectangle (Part A) and a right-angled trapezium (Part B).
Part A – rectangle
Area $$\;= v_1 \times t_1 = 6 \times 120 = 720 \;\mathrm{m}$$
Part B – trapezium
- Initial velocity edge: $$6 \, \mathrm{m\,s^{-1}}$$
- Final velocity edge (after acceleration):
$$v_2 = u + a t_2 = 6 + 1 \times 6 = 12 \;\mathrm{m\,s^{-1}}$$ - Area of trapezium:
$$\text{Area} = \tfrac12(\text{sum of parallel sides})\,(\text{height})$$
$$= \tfrac12 (6 + 12) \times 6 = \tfrac12 (18) \times 6 = 9 \times 6 = 54 \;\mathrm{m}$$
Step 4 : Total displacement
$$\text{Total displacement }\; s = 720 + 54 = 774 \; \mathrm{m}$$
Result
The car covers a displacement of $$774\;\text{m}$$ along the state highway in the given time interval.
Answer
Displacement = $$774\;\mathrm{m}$$
15
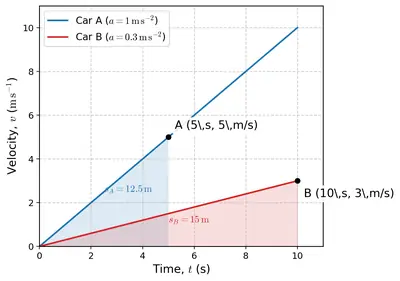
Solution
Given data
- Both cars start from rest, so initial velocity $$u = 0\,\mathrm{m\,s^{-1}}$$.
- Car A reaches a velocity $$v_A = 5\,\mathrm{m\,s^{-1}}$$ in a time $$t_A = 5\,\mathrm{s}$$.
- Car B reaches a velocity $$v_B = 3\,\mathrm{m\,s^{-1}}$$ in a time $$t_B = 10\,\mathrm{s}$$.
1. Calculate the accelerations
Uniform acceleration is given by $$a = \dfrac{v - u}{t}$$.
- For car A:
$$a_A = \dfrac{5 - 0}{5} = 1\,\mathrm{m\,s^{-2}}$$ - For car B:
$$a_B = \dfrac{3 - 0}{10} = 0.3\,\mathrm{m\,s^{-2}}$$
2. Velocities at equal intervals (needed only for plotting)
| t (s) | vA (m s−1) | vB (m s−1) |
|---|---|---|
| 0 | 0 | 0 |
| 1 | $$1\times1=1$$ | $$0.3\times1=0.3$$ |
| 2 | 2 | 0.6 |
| 3 | 3 | 0.9 |
| 4 | 4 | 1.2 |
| 5 | 5 | 1.5 |
| 6 | — (motion of A not required beyond 5 s) | 1.8 |
| 8 | — | 2.4 |
| 10 | — | 3 |
3. How to draw the velocity–time graph
- Draw a pair of perpendicular axes. Take time (s) on the horizontal axis and velocity (m s−1) on the vertical axis.
- Choose a convenient scale (e.g. 1 cm = 1 s along time, 1 cm = 1 m s−1 along velocity).
- For car A plot the points (0,0) and (5 s, 5 m s−1). Join them with a straight line; extend the line only up to 5 s.
- For car B plot the points (0,0) and (10 s, 3 m s−1). Join them with a straight line; extend the line up to 10 s.
- Label the two straight lines as A and B.
The graph will show two straight lines originating at the origin, the steeper one (slope = 1) for car A and the gentler one (slope = 0.3) for car B.
4. Displacement from the graph (area under each v–t line)
For motion with uniform acceleration starting from rest the graph is a right-angled triangle, so
$$\text{Area} = \tfrac12 \times \text{base} \times \text{height} = \tfrac12 t v.$$
- Car A (0–5 s)
Base $$= t_A = 5\,\mathrm{s}$$, height $$= v_A = 5\,\mathrm{m\,s^{-1}}$$:
$$s_A = \tfrac12 \times 5 \times 5 = 12.5\,\mathrm{m}$$ - Car B (0–10 s)
Base $$= t_B = 10\,\mathrm{s}$$, height $$= v_B = 3\,\mathrm{m\,s^{-1}}$$:
$$s_B = \tfrac12 \times 10 \times 3 = 15\,\mathrm{m}$$
5. Result
- Displacement of car A in 5 s = $$12.5\,\mathrm{m}$$.
- Displacement of car B in 10 s = $$15\,\mathrm{m}$$.
Answer
Car A travels $$12.5\,\mathrm{m}$$ in the first 5 s, while car B travels $$15\,\mathrm{m}$$ in the first 10 s.
16
(i) distance travelled,
(ii) displacement,
(iii) speed, and
(iv) velocity.
The length of the minute's hand is 7 cm (Fig. 4.32).
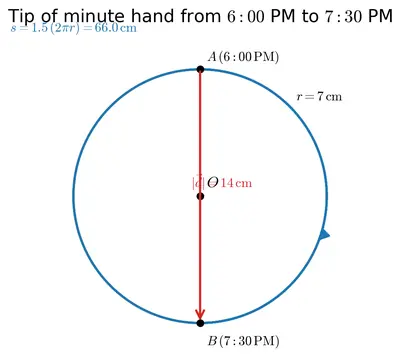
Solution
Known data
- Length (radius) of the minute hand: $$r = 7\,\text{cm}$$
- Study time interval: 6 PM → 7 :30 PM = $$90\,\text{min}$$
- One complete revolution of the minute hand takes $$60\,\text{min}$$.
(i) Distance travelled by the tip
In $$90\,\text{min}$$ the hand turns through
$$\theta = \frac{360^{\circ}}{60\,\text{min}}\times 90\,\text{min} = 540^{\circ}=1.5\,\text{rev}$$
Arc length traced (distance) = number of revolutions × circumference:
$$s = 1.5\,(2\pi r) = 1.5\,(2\pi\times7\,\text{cm}) = 21\pi\,\text{cm} \approx 66\,\text{cm}$$
(ii) Displacement of the tip
At 6 PM the minute hand points to 12 (top of the circle).
At 7 :30 PM it points to 6 (bottom of the circle).
Thus the initial and final positions are opposite ends of a diameter.
Magnitude of displacement:
$$|\vec d| = 2r = 2\times7\,\text{cm}=14\,\text{cm}$$
Direction: vertically downward (towards 6 o'clock on the dial).
(iii) Speed of the tip
$$\text{Speed}=\frac{\text{distance}}{\text{time}} = \frac{21\pi\,\text{cm}}{90\,\text{min}} = \frac{7\pi}{30}\,\text{cm\ min}^{-1}$$
$$\approx 0.733\,\text{cm\ min}^{-1}=\frac{66\,\text{cm}}{5400\,\text{s}}\approx1.22\times10^{-2}\,\text{cm\ s}^{-1}$$
(iv) Velocity of the tip
$$\text{Velocity}=\frac{\text{displacement}}{\text{time}} = \frac{14\,\text{cm}}{90\,\text{min}} = 0.156\,\text{cm\ min}^{-1}$$
In SI units:
$$|\vec v|=\frac{14\,\text{cm}}{5400\,\text{s}} = 2.6\times10^{-3}\,\text{cm\ s}^{-1}=2.6\times10^{-5}\,\text{m\ s}^{-1}$$
Direction: vertically downward, identical to the displacement direction.
Answer
(i) Distance travelled = $$21\pi\,\text{cm}\;\approx\;66\,\text{cm}$$
(ii) Displacement = $$14\,\text{cm}$$ downward
(iii) Speed = $$0.733\,\text{cm\ min}^{-1}\;\;(\approx1.22\times10^{-2}\,\text{cm\ s}^{-1})$$
(iv) Velocity = $$0.156\,\text{cm\ min}^{-1}\;\;(\approx2.6\times10^{-3}\,\text{cm\ s}^{-1})$$ downward
The Journey Beyond
1
Solution
Given set-up
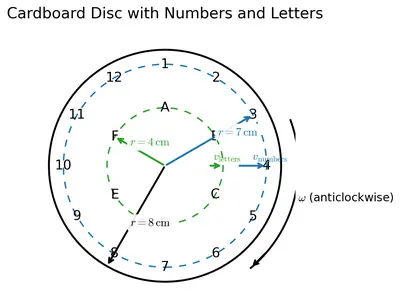
- Cardboard disc, radius $$R \approx 8\,\text{cm}$$.
- 12 identical numbers written on the outer circular strip of radius $$r_1 = 7\,\text{cm}$$.
- 6 identical letters written on an inner circular strip of radius $$r_2 = 4\,\text{cm}$$.
- The size (height, thickness) of every printed character is the same.
The disc is a rigid body; every point on it completes one revolution in exactly the same time.
Step 1 : Define the common angular speed
If the disc makes $$n$$ revolutions per second, the angular speed $$\omega$$ of every point on it is
\[\omega = 2\pi n \;\text{rad s}^{-1}\quad(1)\]Step 2 : Linear (tangential) speed of the two rings
For a point at distance $$r$$ from the centre, linear speed is
\[v = \omega r\quad(2)\]| Ring | Radius | Linear speed |
|---|---|---|
| Outer (numbers) | $$r_1 = 7\,\text{cm}$$ | $$v_1 = \omega r_1$$ |
| Inner (letters) | $$r_2 = 4\,\text{cm}$$ | $$v_2 = \omega r_2$$ |
Taking the ratio,
\[\frac{v_1}{v_2}=\frac{\omega r_1}{\omega r_2}=\frac{r_1}{r_2}=\frac{7}{4}\approx 1.75\quad(3)\]Thus the numbers move about 1.75 times faster along their circular path than the letters do.
Step 3 : Relation with persistence of vision
- The human eye retains an image for roughly $$\tau \approx 1/16\,\text{s}$$.
- In that time a point on the outer ring travels a distance $$d_1 = v_1 \tau$$, while a point on the inner ring covers $$d_2 = v_2 \tau$$.
- Because $$d_1 = 1.75\,d_2$$, the outer character sweeps across a larger arc during the eye’s retention time, so its light is smeared over the retina, producing a blurred patch instead of a sharp symbol.
- The inner character moves a shorter distance in the same interval; its outline is still inside the eye’s resolving limit, so the letter remains readable.
Step 4 : Why the effect increases when spun faster
Increasing $$\omega$$ multiplies both $$v_1$$ and $$v_2$$, but the absolute blurring distance grows. Once $$v_1 \tau$$ exceeds roughly the height of the printed number, the symbol merges into the background and seems to fade. The letters, being nearer the centre, reach this threshold at a much higher angular speed, so they remain visible over the same range.
Step 5 : Same or different speeds?
- Angular speed $$\omega$$: same for every point on the disc (rigid rotation).
- Linear/tangential speed $$v$$: different; directly proportional to the distance from the axis. Hence the numbers (outer ring) have a greater linear speed than the letters (inner ring).
Conclusion
The numbers appear to fade or disappear because their larger linear speed causes greater motion blur within the eye’s persistence time. The letters remain sharply visible because they move more slowly in linear terms. Although their angular speed is identical, the linear speeds of the numbers and letters are different, explaining the observed difference in clarity.
Answer
The whole disc has one angular speed, but linear speed $$v = \omega r$$ grows with radius.
Numbers (at 7 cm) move 1.75 times faster than letters (at 4 cm), so in the eye’s persistence time they sweep a bigger arc and blur out, while the letters remain readable.
Thus angular speeds are the same, linear speeds are different.
2 Many smartphones have an inbuilt accelerometer that can detect very small accelerations. Install an app, such as Phyphox (phyphox.org) and open 'Accelerometer (without $$g$$)'. Note the readings when (i) the phone is on an outstretched palm, and (ii) the phone is kept on the floor. What differences do you observe? What does this tell you about motion and acceleration in real situations? (Such tiny, involuntary movements are also studied in medical research, for example, in movement disorders) This activity is recommended to be performed as a classroom group activity facilitated by teacher.
Solution
Step 1 – Setting up the experiment
Open the app Phyphox → Accelerometer (without $$g$$). The three on-screen numbers give the instantaneous accelerations of the phone along the x, y and z axes in $$\mathrm{m\,s^{-2}}$$. Because the component $$g = 9.8\,\mathrm{m\,s^{-2}}$$ has already been subtracted, the display should read zero whenever the phone truly undergoes no linear acceleration.
Step 2 – Observation A: phone on an outstretched palm
- The numbers jump about continuously, e.g.
x-axis: +0.12 to –0.18, y-axis: –0.25 to 0.30, z-axis: +0.05 to –0.10 (all in $$\mathrm{m\,s^{-2}}$$). - The graph in the app shows an irregular trace whose peaks are typically between $$\pm0.3\,\mathrm{m\,s^{-2}}$$, sometimes a little more if the hand wobbles.
Step 3 – Observation B: phone resting on the floor
- The readings settle close to 0.00 on every axis; only milligal (≈ 10-3 $$\mathrm{m\,s^{-2}}$$) noise is seen.
- The graph becomes a nearly flat line.
Step 4 – Interpreting the difference
Acceleration is defined as the rate of change of velocity: $$a = \dfrac{\Delta v}{\Delta t}$$. When the phone lies on the floor its velocity does not change, so $$\Delta v = 0$$ and the accelerometer detects practically no acceleration. By contrast, an apparently “steady” hand is never perfectly still—continuous, involuntary muscle activity causes tiny to-and-fro motions. Each microscopic jolt produces a small but measurable $$\Delta v$$ every fraction of a second, giving non-zero values of $$a$$.
Step 5 – What this tells us about real motion
- Perfect rest is an idealisation; in real life almost every object is subjected to minute vibrations from muscles, wind, passing vehicles, footsteps, even distant seismic waves.
- Modern sensors are sensitive enough to reveal these accelerations, reminding us that “uniform motion” or “complete rest” is only approximately true.
- Because the pattern of tiny accelerations reflects how our muscles behave, doctors use similar measurements to study tremors in Parkinson’s disease, essential tremor, and other movement disorders.
Key point
The experiment shows that any change in velocity, however small, constitutes acceleration, and that in practical situations such changes are practically unavoidable.
Answer
On the floor the phone shows almost 0 $$\mathrm{m\,s^{-2}}$$ on every axis, but on an outstretched palm the readings keep fluctuating (typically up to about ±0.3 $$\mathrm{m\,s^{-2}}$$). The difference proves that even when we think we are "holding something still", tiny involuntary hand motions keep changing its velocity, so it is continuously accelerated. Absolute rest exists only as an idealisation; in real situations small accelerations are always present and can be used, for example, to analyse human tremors in medical studies.
3 For motion in a straight line with constant acceleration, we derived two primary equations given by Eq. (4.4a) and (4.4b). Using these two equations, three more equations can be derived, out of which we derived one given in Eq. (4.4c). Derive the remaining two equations given below
$$s = vt - \frac{1}{2}at^2 \qquad s = \frac{1}{2}(u+v)\,t$$
In mathematics, you have learnt the formula for calculating the area of a trapezium. Using that formula, derive the second equation given above.
Solution
Known (primary) kinematic equations
- (4.4a) $$v = u + a t$$
- (4.4b) $$s = u t + \frac{1}{2} a t^2$$
Here $$u$$ = initial velocity, $$v$$ = final velocity after time $$t$$, $$a$$ = constant acceleration, $$s$$ = displacement in that time.
1. Derivation of $$s = v t - \dfrac{1}{2} a t^2$$
• Express $$u$$ from Eq. (4.4a):
$$u = v - a t$$
• Substitute this value of $$u$$ in Eq. (4.4b):
$$s = (v - a t) t + \frac{1}{2} a t^2$$
Multiply out the brackets:
$$s = v t - a t^2 + \frac{1}{2} a t^2$$
Combine the like terms in $$a t^2$$:
$$s = v t - \left(1 - \tfrac12\right)a t^2 = v t - \frac{1}{2} a t^2$$
Thus we get the required relation
\[ s = v t - \dfrac{1}{2} a t^2 \]
2. Derivation of $$s = \dfrac{1}{2}(u + v) t$$ by algebra
• Express $$a$$ from Eq. (4.4a):
$$a = \dfrac{v - u}{t}$$
• Insert this in Eq. (4.4b):
$$s = u t + \frac{1}{2} \left(\dfrac{v - u}{t}\right) t^2$$
Simplify the fraction:
$$s = u t + \frac{1}{2}(v - u)t$$
Group terms with the common factor $$t$$:
$$s = \left[u + \frac{1}{2}(v - u)\right] t$$
Combine the velocities inside the bracket:
$$s = \left[\frac{2u + v - u}{2}\right] t = \frac{u + v}{2} \, t$$
Hence
\[ s = \frac{1}{2}(u + v)\, t \]
3. Geometric derivation of $$s = \dfrac{1}{2}(u + v) t$$ using the trapezium area
- Draw a velocity–time graph for uniformly accelerated motion: a straight line starting from velocity $$u$$ at $$t=0$$ and ending at velocity $$v$$ at time $$t$$.
- The area under the line between times $$0$$ and $$t$$ represents the displacement $$s$$.
- The shape enclosed is a trapezium with parallel sides of lengths $$u$$ and $$v$$ and height $$t$$.
- By the formula for the area of a trapezium, $$\text{Area} = \dfrac{1}{2}(\text{sum of parallel sides}) \times (\text{distance between them})$$, we have
$$s = \dfrac{1}{2}(u + v) t$$
This confirms the algebraic result.
Answer
Both required relations are proved:
$$s = v t - \dfrac{1}{2} a t^2$$
$$s = \dfrac{1}{2}(u + v) t$$
4
Solution
Question 4.4 (NCERT Class 9 Physics, Ch. 4)
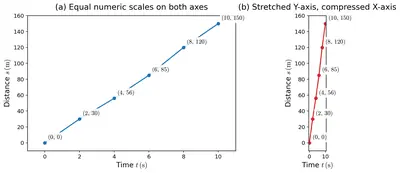
Plot graphs for the data given in Table 4.4, using different X- and Y-scales on different graph papers. Compare the graphs to find how the appearance of a graph is affected by the choice of scales and decide which scale is better and why. Now repeat this with any graph-plotting app. Such apps generally adjust the axes automatically to fit the data on the screen.
Step 1 – Copying the data from Table 4.4
| Time t (s) | Distance s (m) |
|---|---|
| 0 | 0 |
| 2 | 4 |
| 4 | 16 |
| 6 | 36 |
| 8 | 64 |
| 10 | 100 |
(The body starts from rest and accelerates, so $$s\;\propto\;t^{2}$$.)
Step 2 – Choosing three different pairs of scales
- Scale A (large) – X-axis: $$1\,\text{cm}=1\,\text{s}$$; Y-axis: $$1\,\text{cm}=10\,\text{m}$$.
Full data range ⇒ X-length $$=10\,\text{cm}$$, Y-length $$=10\,\text{cm}$$. - Scale B (medium) – X-axis: $$1\,\text{cm}=2\,\text{s}$$; Y-axis: $$1\,\text{cm}=25\,\text{m}$$.
X-length $$=5\,\text{cm}$$, Y-length $$=4\,\text{cm}$$. - Scale C (small) – X-axis: $$1\,\text{cm}=5\,\text{s}$$; Y-axis: $$1\,\text{cm}=50\,\text{m}$$.
X-length $$=2\,\text{cm}$$, Y-length $$=2\,\text{cm}$$.
Step 3 – Plotting on three different sheets
- Draw two mutually perpendicular axes OX (time) and OY (distance). Mark equal divisions according to the selected scale.
- Transfer each (t, s) pair as a neat pencil dot and circle it lightly.
- Join the points smoothly; the expected shape is a curve opening upward (a parabola).
- Add the title, mention both scales and label every 5th division to avoid crowding.
What you will notice
- Scale A fills almost the entire sheet; the curvature is clearly visible, and small plotting errors are easy to detect. Reading intermediate values (e.g. the distance at $$t = 7\,\text{s}$$) can be done by simple interpolation.
- Scale B compresses the graph to roughly one-quarter of the page. The same curve now looks steeper but «flatter» because individual points lie very close to each other; estimating slope or drawing a tangent becomes harder.
- Scale C squeezes the whole graph into only a few square-centimetres. The eye can no longer judge whether the dots really lie on a smooth curve. Any plotting error of even $$1\,\mathrm{mm}$$ changes the apparent shape.
Step 4 – Deciding the better scale
A good scale should
(i) use most of the graph paper so that the plotted area is big;
(ii) give convenient, round numbers for the grid lines; and
(iii) keep the graph in a single quadrant so that no negative values are wasted.
Scale A satisfies all three conditions, therefore it is the best choice for this data set.
Step 5 – Checking with a graph-plotting app
- Enter the six (t, s) points in any free plotting app or the «chart» option of a spreadsheet.
- The program automatically selects its own scales (very similar to Scale A) so the curve occupies most of the window.
- Zoom in or out: the software redraws the axes but always keeps a comfortable margin around the curve. This behaviour imitates the «best-fit» manual choice.
- Therefore, computer apps usually keep graphs readable because they automatically apply the same criteria we used to pick Scale A.
Conclusion
Changing the numerical scale changes only the appearance (steepness, crowding, readability) of the curve, not the physical relation between $$s$$ and $$t$$. The scale that spreads the points over most of the sheet (Scale A or the app’s auto-scale) is best because it minimises plotting error, makes tangents and slopes easy to draw and allows accurate interpolation.
Answer
The graph drawn with Scale A (1 cm = 1 s on X-axis, 1 cm = 10 m on Y-axis) is best because it fills the page, shows the true curvature clearly and permits accurate readings; compressed scales (B and C) make the same data look steeper, crowd the points and hide small errors. Graph-plotting apps automatically choose a spread very close to Scale A for exactly this reason.
5 Talk to a motor mechanic about how a vehicle's braking or stopping distance is affected by: (i) wet roads, (ii) worn-out tyres, (iii) higher vehicle mass, (iv) driving at night, (v) fog, (vi) severe weather (rain, snow, storm), and (vii) driver reaction time. Using this information, design safety posters for your school and prepare a short skit to present it in the assembly.
Solution
Background Physics
The distance a vehicle needs to stop is the sum of two parts.
1. Reaction (thinking) distance $$d_r = v t_r$$ where $$v$$ is the speed of the vehicle and $$t_r$$ is the driver’s reaction time.
2. Braking distance $$d_b = \dfrac{v^2}{2 \mu g}$$ where $$\mu$$ is the coefficient of friction between the tyres and the road surface and $$g$$ is the acceleration due to gravity.
Total stopping distance $$d_s = d_r + d_b$$
Any factor that reduces $$\mu$$ or increases $$v$$, $$m$$ (vehicle mass) or $$t_r$$ makes $$d_s$$ larger. The motor-mechanic’s comments are summarised below, followed by poster ideas and a skit script.
(i) Wet roads
- Water acts as a lubricant; $$\mu$$ falls from about 0.8 (dry asphalt) to 0.3–0.4. Hence $$d_b$$ nearly doubles.
- Aquaplaning risk: tyres ride on a water film and lose almost all grip ⇒ driver must slow down.
(ii) Worn-out tyres
- Tread channels away water; if tread depth < 1.6 mm, water can’t escape ⇒ effective $$\mu$$ drops sharply.
- Rubber becomes hard with age, lowering friction even on dry roads.
(iii) Higher vehicle mass
- Braking force available from the tyres is $$F_{\text{max}} = \mu m g$$. Required deceleration is $$a = F/m = \mu g$$ (independent of $$m$$) if brakes and tyres are ideal.
- In practice, heavier vehicles have hotter brakes, tyre distortion and longer mechanical lag ⇒ longer $$d_b$$.
(iv) Driving at night
- Head-lamp range ≈ 40–60 m on low beam. If $$d_s$$ > illuminated distance, collision risk rises.
- Poor visibility increases $$t_r$$ because objects are detected later.
(v) Fog
- Visibility can fall below 20 m; contrast drops ⇒ reaction time $$t_r$$ rises from 0.7 s (day) to >1.5 s.
- Moisture on road means smaller $$\mu$$ like wet roads.
(vi) Severe weather (rain, snow, storm)
- Snow/ice: $$\mu\rightarrow0.05$$. From the formula, $$d_b$$ on ice can be 16× the dry value.
- Strong cross-winds make braking unstable and drivers hesitate (larger $$t_r$$).
(vii) Driver reaction time
- Fatigue, mobile-phone use, alcohol, medicines ⇒ $$t_r$$ increases 2–4 ×.
- At 72 km h–1 (20 m s–1) each extra 0.5 s adds $$\;d_r = 20\times0.5 = 10\,$$m.
Safety-Poster Package for School
Create three A2 posters. All posters share the slogan “STOPPING DISTANCE SAVES LIVES”.
- Poster 1 – Formula & Graph
• Draw a straight road fading into the distance.
• Bottom corner: show the two equations for $$d_r$$ and $$d_b$$.
• Plot a colourful curve of stopping distance vs speed (20–80 km h–1) on dry vs wet roads.
• Caption: “On wet roads your stop is TWICE as long – slow down!” - Poster 2 – Tyre Tread Gauge
• Picture of a good tyre (deep grooves) next to a bald tyre.
• Include a cut-out 2-rupee coin shape: “If the Ashoka pillar top is visible, change tyres now!”
• Fact bubble: “Worn tyres increase skid risk by 30 % on dry, 70 % on wet.” - Poster 3 – Night & Fog Rules
• Split design: left half night driving, right half dense fog.
• Use silhouettes of a child crossing 50 m ahead.
• Rules list: “Keep low-beam, keep distance, speed ≤ 30 km h–1 in fog.”
Skit for Morning Assembly (5 minutes)
Characters: Narrator (N), Driver 1 (D1 – overconfident), Driver 2 (D2 – cautious), Traffic Cop (C), Chorus of Students (Ch).
Props: Two cardboard cars, a long yellow measuring tape (marked 20 m sections), poster 1 enlarged.
Script Outline
- N: Explains stopping distance formula while unfolding the tape on stage – each 20 m segment labelled as “one second at 72 km h–1”.
- D1 enters fast, bragging. Tyres start squealing (sound effect) but car stops mid-tape – still hits a cardboard “dog”.
- C freezes scene, flips poster 1, points at wet-road curve. Asks audience: “Should he have braked sooner?” Students shout “Yes!”.
- D2 drives slowly, sees the “dog” early, reacts, stops with 5 m spare. Chorus chants: “Slow and safe!”.
- N summarises seven factors, each held up by a student with placard (rain, worn tyre, mass, night, fog, storm, distraction).
- All together: “Remember – distance to stop is longer than you think. Think and STOP!”
Optional classroom extension: Measure braking distance of a bicycle on playground in dry vs wet conditions and plot results.
Answer
Stopping distance grows when roads are wet, tyres are worn, the vehicle is heavy, visibility is poor (night, fog, severe weather) or the driver’s reaction time is long. Safety posters and a 5-minute skit using these facts have been designed in the solution.


