 91- 6303239042


Pause and Ponder
1 Explore various ways of producing sound.
Solution
Key idea — Every sound, no matter how soft or loud, is produced only when some part of a body vibrates. If there is no vibration, there is no sound. Hence to “explore ways of producing sound” we really have to examine the different practical methods by which we can set material objects into rapid to-and-fro motion.
Below the several methods are grouped according to what is made to vibrate and how the vibration is started. Typical class-room or everyday examples are also supplied so that you can see, hear and even feel the vibrations yourself.
-
Plucking, bowing or striking a stretched string
- A taut string has tension $$T$$ and, when displaced sideways and released, executes oscillations with time-period $$\displaystyle T_{\text{string}}$$ and frequency $$f = \frac{1}{T_{\text{string}}}$$.
- Plucked: guitar, sitar, harp (finger pulls the string, releases it).
Bowed: violin, cello (rosin-coated bow rubs the string repeatedly, keeping it vibrating).
Struck: piano (a felt hammer hits the string for an instant). - The vibrating string in each case sets the surrounding air into compressions and rarefactions, which travel outward as longitudinal waves → sound.
-
Striking or tapping a stretched membrane
- A thin sheet (leather, plastic) is tightly fixed along its rim; the membrane can freely bulge in and out.
- When hit by the player’s hand, sticks or mallets, the membrane vibrates up and down.
- Examples: tabla, mridangam, dholak, kettle-drum, Western drum-set snare/bass.
- The air immediately touching the membrane is forced to move, thus launching sound waves.
-
Setting an air column into vibration by blowing
- An air column has natural resonant frequencies depending on its effective length $$L$$ and whether the ends are open or closed. For an open pipe the fundamental is \[f_1 = \frac{v}{2L}\] where $$v$$ is the speed of sound in air.
- We supply energy by blowing: steady stream, puffs or reeds flap, and the air column itself starts alternating compression and expansion.
- Examples: flute, recorder, clarinet, saxophone, trumpet, whistle, organ pipes.
-
Striking a rigid plate, bar or bell
- Thin metal plate (cymbal), solid bar (xylophone key) or cup-shaped bell has its own “ringing” natural modes. A quick tap displaces particles of the solid, after which they oscillate elastically.
- Examples: tuning fork (U-shaped bar), school bell, temple bell, triangle, ghungroo.
- You can feel the vibration by lightly touching a ringing bell a few seconds after striking — it stops instantly if you damp it by gripping, proving that vibration was the cause of sound.
-
Rubbing or frictional excitation
- Continuous rubbing can keep an object vibrating (stick-slip mechanism).
- Run a wet finger round the rim of a crystal wine-glass: the glass wall flexes in and out, producing a clear tone.
- The bowing of a violin string (already mentioned) is also a rubbing process rather than a single impact.
-
Vibration of human (or animal) vocal cords
- Two flexible muscular folds inside the larynx are held under tension.
- Air pushed up from the lungs causes them to flap open and shut ≈ 80 – 1000 times every second, depending on gender, age and pitch.
- The vibrating cords modulate the outgoing air stream → speech and singing.
-
Electromechanical devices
- Loudspeaker diaphragm: An alternating current $$I(t)$$ flows through a coil in a radial magnetic field, producing a force $$F(t) \propto I(t)$$ on the coil and attached paper cone. The cone oscillates exactly in step with the electric signal, thereby “converting” it into sound.
- Buzzers and electric bells: A make-and-break circuit repeatedly attracts and releases an armature, giving audible buzzing.
- Piezoelectric crystals: Apply an alternating voltage → the crystal alternately expands and contracts, creating ultrasonic sound (used in medical scanning, sonar, electronic beepers).
Conclusion
Whatever the instrument or device, the chain is always:
Source of energy → Some part of a material body set into vibration → Vibration transmitted to the surrounding medium (usually air) → Sound reaches the ear.
Thus we have systematically explored the common practical ways of starting those essential vibrations — plucking, striking, blowing, rubbing, and even feeding alternating electric power.
Answer
Sound can be produced by setting any object into vibration, most commonly in one of the following ways:
- Plucking, bowing or striking taut strings (guitar, violin, piano).
- Striking a stretched membrane (tabla, drums).
- Blowing to vibrate an air column (flute, whistle, trumpet).
- Striking solid plates, bars or bells (tuning fork, school bell, xylophone).
- Rubbing/friction to maintain vibration (wet-finger on glass, bow on violin).
- Vibration of vocal cords (human voice, animal calls).
- Electromechanical methods using alternating current (loudspeaker, buzzer, piezoelectric beeper).
In every case the vibrating body disturbs the surrounding air, and the resulting compressions and rarefactions travel to the ear as sound.
2 Make a list of different types of musical instruments and identify their vibrating parts which produce sound.
Solution
Step 1 ‒ Recall the basic fact
Whatever the instrument, some part of it must vibrate rapidly to set the surrounding air into vibrations; the ear then recognises these pressure variations as sound.
The vibrating part can be
- a tightly stretched string,
- an enclosed air column,
- a stretched membrane, or
- a rigid plate / body of the instrument itself.
Step 2 ‒ Collect representative instruments
From day-to-day life and text-book examples we pick instruments of each type so that the list is broad enough for an examination answer.
Step 3 ‒ Match every instrument with its vibrating part
| S. No. | Musical instrument | Category | Part that actually vibrates and produces sound |
|---|---|---|---|
| 1 | Sitar | String instrument | The stretched steel/nylon strings |
| 2 | Violin | String instrument | The stretched gut/steel strings |
| 3 | Guitar | String instrument | The plucked or strummed strings |
| 4 | Flute (bansuri) | Wind instrument | The enclosed air column inside the tube |
| 5 | Trumpet | Wind instrument | The vibrating air column set in motion by the player’s lips |
| 6 | Harmonium / Reed organ | Wind instrument | The vibrating air column and metal reeds inside |
| 7 | Tabla | Percussion (membrane) | The stretched leather membrane on the top surface |
| 8 | Mridangam / Dholak | Percussion (membrane) | The stretched membrane on either side of the barrel |
| 9 | Drum set – snare/bass drum | Percussion (membrane) | The synthetic or hide drumhead |
| 10 | Cymbals (manjira) | Solid plate instrument | The whole metal plate vibrates after striking |
| 11 | Xylophone | Solid bar instrument | Each wooden/metal bar that is struck |
| 12 | Bell / Ghatam | Resonant body | The entire metal/clay body of the bell or pot |
Step 4 ‒ State the result clearly
Every musical instrument works on the same principle: a specific part of it is set into rapid to-and-fro motion (vibration); that vibrating part for each of the common instruments is listed above.
Answer
Examples and their vibrating parts:
- Sitar, violin, guitar → stretched strings
- Flute, trumpet, harmonium → enclosed air column
- Tabla, mridangam, drum → stretched membrane
- Cymbals, xylophone, bell → the whole metal/wooden body or plate
3
Assertion (A): We cannot hear the sound of a bell ringing in a closed jar after most of the air is pumped out.
Reason (R): Sound requires a medium to travel.
Choose the correct statement:
- Both A and R are true, but R is not the correct explanation of A.
- Both A and R are true, and R is the correct explanation of A.
- A is true, but R is false.
- A is false, but R is true.
Solution
Step 1 – Recall the bell-jar experiment
A small electric bell is placed under a glass bell-jar connected to a vacuum pump. At the start, the bell is switched on and rings loudly. As air is gradually pumped out, the sound heard outside becomes fainter and finally vanishes, even though we can still see the hammer striking the gong.
Step 2 – Explain what the experiment proves
Sound is a mechanical wave; the vibrating source first sets the neighbouring particles of the medium into vibration. These, in turn, disturb the next layer, and so on. Hence a continuous material medium is required to transport the energy from the source to the listener.
Mathematically we say that the speed of sound is given by
$$v = \sqrt{\frac{B}{\rho}}$$
where $$B$$ is the bulk modulus and $$\rho$$ the density of the medium. If the medium is removed (i.e. $$\rho \to 0$$), the quantity under the square root loses its physical meaning and sound cannot propagate.
Step 3 – Check the truth of the statements
- Assertion (A): “We cannot hear the sound of a bell ringing in a closed jar after most of the air is pumped out.” – This matches the observed result of the bell-jar experiment, so A is true.
- Reason (R): “Sound requires a medium to travel.” – As explained above, sound does need a material medium, so R is true.
Step 4 – Does R explain A?
Yes. The very reason we fail to hear the bell is that the air (the medium) has been removed; without a medium, sound cannot reach our ears. Thus R is the correct explanation of A.
Step 5 – Choose the correct option
The correct statement is Option 2.
Both A and R are true, and R is the correct explanation of A.
Answer
Option 2
4
Assertion (A): Compressions and rarefactions move through the medium.
Reason (R): Individual particles of the medium continuously move forward with the wave.
Choose the correct statement:
- Both A and R are true, but R is not the correct explanation of A.
- Both A and R are true, and R is the correct explanation of A.
- A is true, but R is false.
- A is false, but R is true.
Solution
Step 1 — Recall how a sound wave travels
In air, a sound is a longitudinal mechanical wave. The disturbance is an alternating series of regions where the air is:
- compressed → higher density and pressure, called a compression (C)
- rarefied → lower density and pressure, called a rarefaction (R)
Step 2 — Describe the motion of individual particles
Consider any small volume of air. When the wave passes, its particles oscillate to and fro about a fixed mean position:
\[x(t)=A\sin(\omega t)\]
They move only a small distance to either side of that position and then return; they do not travel along with the wave from the source to the listener. Energy moves forward, matter does not.
Step 3 — Test the statements
Assertion (A): “Compressions and rarefactions move through the medium.” — This is true; it is exactly how a sound wave advances.
Reason (R): “Individual particles of the medium continuously move forward with the wave.” — This is false; particles merely vibrate about fixed positions.
Step 4 — Choose the correct option
A is true, R is false ⟹ Option (3).
Answer
3
5
When sound travels from a tuning fork to your ear, which of the following actually reaches your ear?
- Air particles near the tuning fork
- Energy carried by sound waves
- The tuning fork material
- A continuous stream of compressed air
Solution
Step 1 · Recall how sound is transmitted
When a body such as a tuning fork vibrates, it produces compressions (high-pressure regions) and rarefactions (low-pressure regions) in the surrounding air. These successive compressions and rarefactions constitute a mechanical longitudinal wave.
Step 2 · Nature of particle motion in a sound wave
Air particles near the tuning fork do not travel all the way to your ear. Each particle only oscillates to and fro about its mean position. After a small displacement $$x$$ toward the fork and back, its average position remains unchanged. Thus there is no net mass transport of air from the source to the listener.
Step 3 · What moves from the source to the listener?
Although the particles merely oscillate locally, the disturbance created by those oscillations is handed on from one layer of air to the next. This hand-over carries energy through the medium. What finally reaches your eardrum is therefore the energy of the sound wave, not the bulk motion of matter.
Step 4 · Examine each option
- (i) Air particles near the tuning fork — No (they only vibrate in place).
- (ii) Energy carried by sound waves — Yes.
- (iii) The tuning-fork material — No (the fork remains at the source).
- (iv) A continuous stream of compressed air — No (pressure changes are alternating, not a one-way flow).
Step 5 · Conclude
Hence, the only correct choice is option (ii).
Answer
(ii) Energy carried by sound waves
6
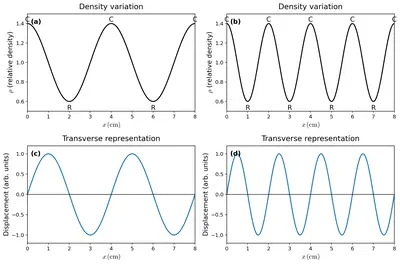
Solution
Key idea : For a longitudinal sound wave the local density varies as a sine curve $$\rho(x)=\rho_0+\Delta\rho_{\max}\sin kx$$.
• Crests (maximum $$\rho$$) are compressions (C).
• Troughs (minimum $$\rho$$) are rarefactions (R).
1. Fig. 10.17 (a) and (b) → Labelling
- Put the letter C at every peak of the density curve.
- Put the letter R at every valley of the density curve.
Thus each peak–valley pair represents one wavelength $$\lambda$$ of the sound wave.
2. Fig. 10.17 (c) and (d) → Completing the blank graphs
- Label the axes
x-axis : Distance / Position, $$x\,(\text{m})$$
y-axis : Density, $$\rho\,(\text{kg m}^{-3})$$ - Draw the curves
• In Fig. 10.17 (c) sketch a sine-wave exactly like that in part (a) — same amplitude and wavelength. Mark every crest with C and every trough with R.
• In Fig. 10.17 (d) sketch a sine-wave exactly like that in part (b) — reproducing its (shorter/longer) wavelength and amplitude. Again write C at each crest and R at each trough.
Once the peaks and valleys are so marked and the axes are named, the two required graphs are complete.
Answer
Mark every peak as C (compression) and every valley as R (rarefaction). On the blank axes write x (m) horizontally and ρ (kg m−3) vertically, then copy the sine-curves of parts (a) and (b) in parts (c) and (d) respectively, with C at each crest and R at each trough.
7 Conduct Activity 10.1 once again with a thick rubber band and then with a thin rubber band. Does the thin rubber band vibrate faster than the thick rubber band? If yes, how do the frequency and time period of the sound produced by the thin rubber band differ from that of the thick rubber band?
Solution
Step 1 – Recap of Activity 10.1
In Activity 10.1 a stretched rubber band is plucked sideways; it vibrates and produces sound. The number of complete to-and-fro vibrations made in one second is the frequency $$f$$, and the time taken for one complete vibration is the time period $$T_p$$.
Step 2 – Perform the activity with two bands
(1) Stretch a thick rubber band between two fingers to a fixed length $$L$$ and with the same steady pull (tension) $$T$$ each time. Pluck it and listen.
(2) Replace it by a thin rubber band, keep the length $$L$$ and tension $$T$$ unchanged, pluck, and listen again.
The thin band is seen to vibrate more rapidly and produces a shriller (higher-pitched) sound.
Step 3 – Why does the thin band vibrate faster?
For a stretched string or rubber band the fundamental (lowest) frequency is
$$f = \frac{1}{2L}\sqrt{\frac{T}{\mu}}$$
where
$$L$$ = stretched length (same for both bands),
$$T$$ = tension in the band (same for both bands),
$$\mu$$ = mass per unit length (linear mass density).
A thin rubber band has a smaller mass per unit length (smaller $$\mu$$) than a thick one. Since $$f \propto \dfrac{1}{\sqrt{\mu}}$$, the smaller $$\mu$$ of the thin band makes its frequency larger. Thus the thin band completes more vibrations every second – it vibrates faster.
Step 4 – Comparing time periods
The time period $$T_p$$ and frequency $$f$$ are related by
$$T_p = \frac{1}{f}$$
Therefore, when the thin band has a higher frequency, its time period is automatically smaller:
$$f_{\text{thin}} > f_{\text{thick}} \;\; \Longrightarrow \;\; T_{p,\,\text{thin}} = \frac{1}{f_{\text{thin}}} < T_{p,\,\text{thick}} = \frac{1}{f_{\text{thick}}}$$
Conclusion
- Yes, the thin rubber band vibrates faster than the thick rubber band.
- Consequently, the sound from the thin band has a higher frequency (higher pitch) and a smaller time period than the sound from the thick band.
Answer
Yes. The thin rubber band has a higher frequency and, since $$T_p = 1/f$$, a correspondingly smaller time period than the thick rubber band.
8 If the frequency of a sound wave produced by an oscillating piston of a long tube filled with air is $$20\,\mathrm{Hz}$$, then how many oscillations does the piston complete per minute?
Solution
Given data
- Frequency of the sound wave: $$f = 20\,\mathrm{Hz}$$
- By definition, $$1\,\mathrm{Hz} = 1\text{ oscillation per second}$$.
Step 1: Interpret the meaning of frequency
Because $$f = 20\,\mathrm{Hz}$$, the piston makes $$20$$ complete oscillations in $$1\,\text{s}$$:
$$\text{Oscillations in }1\,\text{s} = 20$$
Step 2: Find the time interval of interest
We need the number of oscillations in one minute:
$$1\,\text{minute} = 60\,\text{s}$$
Step 3: Use the definition of frequency
Number of oscillations $$N$$ in any time $$t$$ is
$$N = f \times t$$
Substitute $$f = 20\,\mathrm{Hz}$$ and $$t = 60\,\text{s}$$:
\[ N = 20\,\mathrm{Hz} \times 60\,\text{s} = 1200 \text{ oscillations} \]
Conclusion
The piston completes $$1200$$ oscillations in one minute.
Answer
$$N = 1200\text{ oscillations per minute}$$
9
Solution
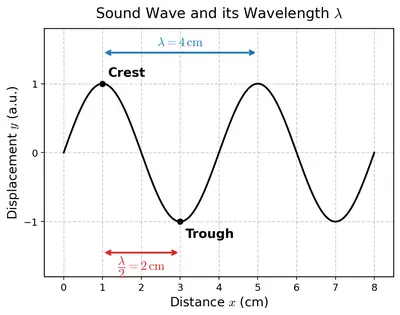
Step 1 Identify one full wavelength on the graph
For a displacement vs. distance graph, the horizontal distance between two successive crests (or two successive troughs) equals one wavelength $$\lambda$$.
From Fig. 10.19 we read:
- The first crest is directly above the point marked $$x = 1\,\text{cm}$$.
- The next crest is directly above the point marked $$x = 5\,\text{cm}$$.
$$\lambda = 5\,\text{cm} - 1\,\text{cm} = 4\,\text{cm}$$
Step 2 Find half of the wavelength
The required quantity is $$\dfrac{\lambda}{2}$$, so
$$\dfrac{\lambda}{2} = \dfrac{4\,\text{cm}}{2} = 2\,\text{cm}$$
Result
\[\boxed{\dfrac{\lambda}{2} = 2\,\text{cm}}\]
Answer
$$\displaystyle \tfrac{1}{2}\;\text{wavelength}=2\,\text{cm}$$
10
Table 10.1 shows the speed of sound in a few media at atmospheric pressure.
Table 10.1: Speed of sound in different media at $$15\,{}^{\circ}\mathrm{C}$$
| State | Substance/Medium | Approximate speed |
|---|---|---|
| Solid | Steel | $$5000\,\mathrm{m\,s^{-1}}$$ |
| Liquid | Water | $$1500\,\mathrm{m\,s^{-1}}$$ |
| Gas | Air | $$340\,\mathrm{m\,s^{-1}}$$ |
Compare the speeds in different media by finding the ratio of (i) the speed of sound in water with respect to the speed in the air. (ii) the speed of sound in steel with respect to the speed in the water.
Solution
Given data from Table 10.1
- Speed of sound in air at $$15\,{}^{\circ}\mathrm{C}$$, $$v_{\text{air}} = 340\,\mathrm{m\,s^{-1}}$$
- Speed of sound in water at $$15\,{}^{\circ}\mathrm{C}$$, $$v_{\text{water}} = 1500\,\mathrm{m\,s^{-1}}$$
- Speed of sound in steel at $$15\,{}^{\circ}\mathrm{C}$$, $$v_{\text{steel}} = 5000\,\mathrm{m\,s^{-1}}$$
We have to form two ratios.
(i) Ratio of the speed in water to the speed in air
Start with the definition of a ratio:
$$ \text{Ratio} = \frac{\text{speed in water}}{\text{speed in air}} = \frac{v_{\text{water}}}{v_{\text{air}}} $$
Substituting the numerical values,
$$ \frac{v_{\text{water}}}{v_{\text{air}}} = \frac{1500\,\mathrm{m\,s^{-1}}}{340\,\mathrm{m\,s^{-1}}} $$
The units cancel, so the ratio is unit-less:
$$ = \frac{1500}{340} $$
Simplify step by step:
- Divide numerator and denominator by 10: $$ \dfrac{150}{34} $$
- Now divide by 2 again: $$ \dfrac{75}{17} $$
Thus the exact ratio is $$75:17$$.
For a decimal form, perform the division:
$$ \frac{75}{17} \approx 4.41 $$
Hence,
\[\boxed{\dfrac{v_{\text{water}}}{v_{\text{air}}}=\dfrac{75}{17}\;\text{(about }4.4\text{:}1)}\](ii) Ratio of the speed in steel to the speed in water
Again apply the definition:
$$ \text{Ratio} = \frac{\text{speed in steel}}{\text{speed in water}} = \frac{v_{\text{steel}}}{v_{\text{water}}} $$
Insert the values:
$$ \frac{v_{\text{steel}}}{v_{\text{water}}} = \frac{5000\,\mathrm{m\,s^{-1}}}{1500\,\mathrm{m\,s^{-1}}} $$
Cancel the units:
$$ = \frac{5000}{1500} $$
Simplify common factor 500:
- Divide by 500: $$ \dfrac{10}{3} $$
The exact ratio is therefore $$10:3$$.
Expressing as a decimal:
$$ \frac{10}{3} \approx 3.33 $$
So,
\[\boxed{\dfrac{v_{\text{steel}}}{v_{\text{water}}}=\dfrac{10}{3}\;\text{(about }3.3\text{:}1)}\]Conclusion
- Sound travels roughly four-and-a-half times faster in water than in air.
- Sound travels a little more than three times faster in steel than in water.
Answer
(i) $$v_{\text{water}}:v_{\text{air}} = 75:17 \;\approx 4.4:1$$
(ii) $$v_{\text{steel}}:v_{\text{water}} = 10:3 \;\approx 3.3:1$$
11
Solution
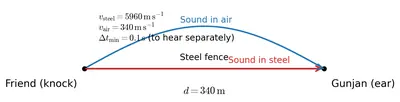
Given data (from Table 10.1)
- Distance between the two friends (length of the fence) : $$d = 340\,\text{m}$$
- Speed of sound in air : $$v_{\text{air}} = 340\,\mathrm{m\,s^{–1}}$$
- Speed of sound in steel : $$v_{\text{steel}} = 5960\,\mathrm{m\,s^{–1}}$$
1. Time taken by the sound to travel through air
The sound travels the same distance d through air, so
$$t_{\text{air}} = \frac{d}{v_{\text{air}}}$$
Substituting the values,
$$t_{\text{air}} = \frac{340\,\text{m}}{340\,\mathrm{m\,s^{–1}}} = 1.0\,\text{s}$$
2. Time taken by the sound to travel through steel
For the same distance through the steel fence,
$$t_{\text{steel}} = \frac{d}{v_{\text{steel}}}$$
$$t_{\text{steel}} = \frac{340\,\text{m}}{5960\,\mathrm{m\,s^{–1}}} = 0.057\,\text{s}$$
3. Time difference between the two sounds
$$\Delta t = t_{\text{air}} - t_{\text{steel}}$$
$$\Delta t = 1.0\,\text{s} - 0.057\,\text{s} = 0.94\,\text{s}$$
4. Can the two sounds be distinguished?
The human ear can separate two sounds only if the gap between them is at least $$0.1\,\text{s}$$. Here, $$\Delta t = 0.94\,\text{s}$$, which is far greater than $$0.1\,\text{s}$$.
Therefore, Gunjan will clearly hear two distinct sounds—the one that comes through the steel first, followed (almost a second later) by the one that comes through the air.
Answer
Time difference $$\Delta t \approx 0.94\,\text{s}$$; yes, she would easily hear the two sounds separately.
12 An experiment is being set up that requires echoes to arrive at least $$0.2\,\mathrm{s}$$ after the emission of sound. What minimum distance should a reflecting surface be placed at? Assume the speed of sound to be $$343\,\mathrm{m\,s^{-1}}$$.
Solution
Given data
- Speed of sound, $$v = 343\,\mathrm{m\,s^{-1}}$$
- Minimum time gap required between the original sound and the echo, $$\Delta t = 0.2\,\mathrm{s}$$
Concept used
An echo is heard when the sound wave travels to the reflecting surface and comes back to the listener. If the surface is at a distance $$d$$ from the source (and listener), the sound actually covers a total path length of $$2d$$.
Relating distance, speed and time
The basic relation is
$$\text{time} = \frac{\text{distance}}{\text{speed}}$$
For the round trip of the sound wave, this becomes
$$\Delta t = \frac{2d}{v}$$
Insert the known values
$$0.2 = \frac{2d}{343}$$
Solve for $$d$$
Multiply both sides by $$343$$:
$$343 \times 0.2 = 2d$$
$$68.6 = 2d$$
Divide by $$2$$:
$$d = \frac{68.6}{2}$$
$$d = 34.3\,\mathrm{m}$$
Interpretation
The reflecting surface must be placed at least $$34.3\,\mathrm{m}$$ away from the source (and listener) so that the echo returns no sooner than $$0.2\,\mathrm{s}$$ after the emission of sound.
Answer
13 Sound travels much farther in water than light, and thus, is used for various underwater applications. A sonar signal sent to find the depth of ocean takes $$4\,\mathrm{s}$$ to return. What is the depth of the ocean at that location if the speed of sound in seawater is $$1500\,\mathrm{m\,s^{-1}}$$?
Solution
Given data
- Total time taken by the sonar pulse to go down to the seabed and return, $$t = 4\,\mathrm{s}$$.
- Speed of sound in seawater, $$v = 1500\,\mathrm{m\,s^{-1}}$$.
Step 1 — Find the total distance travelled by the sound pulse
The basic relation between speed, distance and time is
$$v = \dfrac{\text{distance}}{\text{time}}\;.$$
Hence the total distance travelled by the sound wave (down to the seabed and back) is
$$\text{distance} = v\,t = 1500\,\mathrm{m\,s^{-1}} \times 4\,\mathrm{s} = 6000\,\mathrm{m}. $$
Step 2 — Relate total distance to the actual depth
The sound pulse covers the path twice — once on the way down and once on the way up. Therefore, the one-way distance (the depth of the ocean at that spot) is half of the total distance:
$$\text{depth} = \dfrac{\text{total distance}}{2} = \dfrac{6000\,\mathrm{m}}{2} = 3000\,\mathrm{m}. $$
Step 3 — State the final result
The depth of the ocean at that location is
\[ d = 3.0 \times 10^{3}\,\mathrm{m} \; ( = 3000\,\mathrm{m}). \]
Answer
Depth of the ocean = $$3.0\times10^{3}\,\mathrm{m}$$ (or $$3000\,\mathrm{m}$$).
Examples
Example 10.1 If there are 10 density oscillations in 2 seconds at a given position, then calculate the (i) frequency of sound wave, and (ii) its time period.
Solution
Given data
- Number of density oscillations observed = n = 10
- Time taken for these oscillations = t = 2 s
Each complete density change (from one compression to the next) counts as one oscillation of the wave. Hence, the number of oscillations per second is the frequency.
(i) Frequency of the sound wave
The definition of frequency is: $$f = \dfrac{\text{Number of oscillations}}{\text{Total time}}$$
Substituting the given numbers:
$$f = \dfrac{n}{t} = \dfrac{10}{2\,\text{s}}$$
$$f = 5\;\text{Hz}$$
Therefore, the frequency of the sound wave is
\[f = 5\;\text{hertz}\](ii) Time period of the sound wave
The time period $$T$$ is the reciprocal of frequency:
$$T = \dfrac{1}{f}$$
Putting $$f = 5\,\text{Hz}:$$
$$T = \dfrac{1}{5\,\text{s}^{-1}} = 0.2\,\text{s}$$
\[T = 0.2\;\text{second}\]Results
- Frequency: $$5\,\text{Hz}$$
- Time period: $$0.2\,\text{s}$$
Answer
(i) Frequency = $$5\,\text{Hz}$$
(ii) Time period = $$0.2\,\text{s}$$
Example 10.2 Human hearing roughly spans $$20\,\mathrm{Hz}$$ to $$20\,\mathrm{kHz}$$. What are the corresponding wavelengths in air for these two frequencies? Use the speed of sound in air as $$344\,\mathrm{m\,s^{-1}}$$.
Solution
We know the fundamental relation that links the speed of a wave, its frequency and its wavelength:
$$v = f\,\lambda$$
where
- $$v$$ is the speed of the wave,
- $$f$$ is its frequency, and
- $$\lambda$$ (Greek letter lambda) is its wavelength.
Re-arranging the formula to make wavelength the subject,
$$\lambda = \dfrac{v}{f}$$
The speed of sound in air at ordinary room conditions is given as $$v = 344\,\mathrm{m\,s^{-1}}$$.
1. Wavelength for the lowest audible frequency (20 Hz)
For $$f = 20\,\mathrm{Hz}$$:
$$\lambda_{\text{low}} = \dfrac{344\,\mathrm{m\,s^{-1}}}{20\,\mathrm{Hz}}$$
$$\lambda_{\text{low}} = 17.2\,\mathrm{m}$$
2. Wavelength for the highest audible frequency (20 kHz)
First convert kilohertz to hertz:
$$20\,\mathrm{kHz} = 20 \times 1000\,\mathrm{Hz} = 20000\,\mathrm{Hz}$$
Now calculate the wavelength:
$$\lambda_{\text{high}} = \dfrac{344\,\mathrm{m\,s^{-1}}}{20000\,\mathrm{Hz}}$$
$$\lambda_{\text{high}} = 0.0172\,\mathrm{m}$$
It is sometimes convenient to express this very short length in centimetres:
$$0.0172\,\mathrm{m} = 1.72\,\mathrm{cm}$$
Hence, the wavelengths of sound in air that bound the normal human hearing range (20 Hz to 20 kHz) are approximately
\[\lambda_{20\,\text{Hz}} \approx 17.2\,\mathrm{m}, \qquad \lambda_{20\,\text{kHz}} \approx 0.0172\,\mathrm{m}\,(1.72\,\mathrm{cm}).\]
Answer
$$\lambda_{20\,\text{Hz}} \approx 17.2\,\mathrm{m},\quad \lambda_{20\,\text{kHz}} \approx 0.0172\,\mathrm{m}\;\text{(or }1.72\,\mathrm{cm}\text{)}.$$
Example 10.3 During a thunderstorm, lightning is seen before thunder is heard because sound travels much slower than light. If the time delay between seeing the lightning flash and hearing the thunder is measured to be $$5\,\mathrm{s}$$, estimate the distance to the lightning strike. Use the speed of sound in air as $$340\,\mathrm{m\,s^{-1}}$$. Assume that light (speed = $$300000\,\mathrm{km\,s^{-1}}$$) reaches you almost instantaneously.
Solution
Given data
- Speed of sound in air: $$v = 340\,\mathrm{m\,s^{-1}}$$
- Time delay between flash and thunder: $$t = 5\,\mathrm{s}$$
- Speed of light: $$c = 300000\,\mathrm{km\,s^{-1}} = 3\times10^{8}\,\mathrm{m\,s^{-1}}$$ (so large that its travel time over a few kilometres is negligible)
Concept used
Distance travelled by any wave is given by the relation
$$\text{distance} = \text{speed} \times \text{time}$$
Because light reaches the observer almost instantaneously, the measured time delay $$t$$ corresponds entirely to the time taken by sound to travel from the lightning strike to the observer.
Calculation
Distance to the lightning strike, $$d$$, is therefore
$$d = v \times t$$
Substituting the given values,
$$d = 340\,\mathrm{m\,s^{-1}} \times 5\,\mathrm{s}$$
$$d = 1700\,\mathrm{m}$$
To express this distance in kilometres, divide by $$1000$$:
$$d = \dfrac{1700\,\mathrm{m}}{1000} = 1.7\,\mathrm{km}$$
Result
The lightning strike occurred at a distance of
from the observer.
Answer
Distance to the lightning strike: $$1.7\,\mathrm{km}$$
Example 10.4
Solution
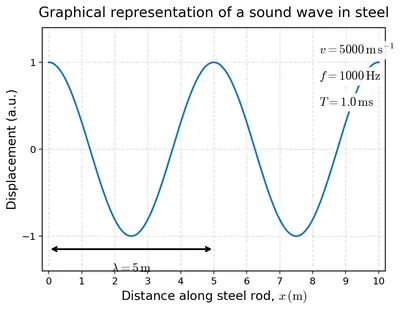
Step 1 : Reading the wavelength from the graph
The graph (Fig. 10.22) shows a longitudinal wave travelling through steel. Two consecutive compressions (C–C) or two consecutive rarefactions (R–R) are separated by one complete wavelength.
From the horizontal scale printed below the figure we note:
- position of the first compression C1 = $$(0.0\,\text{cm})$$
- position of the next compression C2 = $$(1.0\,\text{cm})$$
Hence the distance between C1 and C2 is
$$\lambda = 1.0\,\text{cm}$$
Converting to SI units,
$$\lambda = 1.0\,\text{cm} = 1.0 \times 10^{-2}\,\text{m} = 0.01\,\text{m}$$
Step 2 : Finding the frequency
For any wave,
$$v = \lambda \, \nu$$
where v is the speed of the wave, $$\lambda$$ its wavelength and $$\nu$$ its frequency.
Substituting the given speed $$v = 5000\,\text{m s}^{-1}$$ and $$\lambda = 0.01\,\text{m}$$,
$$\nu = \dfrac{v}{\lambda} = \dfrac{5000\,\text{m s}^{-1}}{0.01\,\text{m}} = 5.0 \times 10^{5}\,\text{Hz}$$
Step 3 : Calculating the time-period
Time-period T is the reciprocal of frequency.
$$T = \dfrac{1}{\nu} = \dfrac{1}{5.0 \times 10^{5}\,\text{Hz}} = 2.0 \times 10^{-6}\,\text{s}$$
Result
| Quantity | Value |
|---|---|
| Wavelength $$\lambda$$ | $$1.0\,\text{cm}=0.01\,\text{m}$$ |
| Frequency $$\nu$$ | $$5.0 \times 10^{5}\,\text{Hz}$$ |
| Time-period $$T$$ | $$2.0 \times 10^{-6}\,\text{s}$$ |
Answer
$$\lambda = 1.0\,\text{cm}=0.01\,\text{m},\; \nu = 5.0 \times 10^{5}\,\text{Hz},\; T = 2.0 \times 10^{-6}\,\text{s}$$
Example 10.5 You clap in an empty corridor and hear an echo after $$0.5\,\mathrm{s}$$. If the speed of sound in air is $$340\,\mathrm{m\,s^{-1}}$$, calculate your distance from the wall.
Solution
Given data
- Time between the clap and the echo heard: $$t = 0.5\,\mathrm{s}$$
- Speed of sound in air: $$v = 340\,\mathrm{m\,s^{-1}}$$
Idea
The time measured ($$t$$) is the time taken by the sound to travel from you to the wall and back. Thus the sound wave actually covers twice your unknown distance $$d$$ from the wall.
Step 1 — Write the speed formula
For any uniform motion:
$$v = \dfrac{\text{distance}}{\text{time}}$$
Here the distance travelled by the sound is $$2d$$ and the time is $$t$$, so
$$v = \dfrac{2d}{t}$$
Step 2 — Solve for \(d\)
Multiply both sides by $$t$$ and divide by $$2$$:
$$2d = v t \;\;\;\;\Longrightarrow\;\;\;\; d = \dfrac{v t}{2}$$
Step 3 — Substitute the numerical values
$$d = \dfrac{(340\,\mathrm{m\,s^{-1}})(0.5\,\mathrm{s})}{2}$$
$$d = \dfrac{170\,\mathrm{m}}{2}$$
$$d = 85\,\mathrm{m}$$
Conclusion
You are $$85\,\mathrm{m}$$ away from the wall.
Answer
$$d = 85\,\mathrm{m}$$
Example 10.6 A naval sonar signal sent into seawater returns after $$0.90\,\mathrm{s}$$. The speed of sound in seawater is $$1530\,\mathrm{m\,s^{-1}}$$. How far is the object?
Solution
Given data
- Time interval between sending the sonar pulse and receiving the echo: $$t = 0.90\,\mathrm{s}$$
- Speed of sound in seawater: $$v = 1530\,\mathrm{m\,s^{-1}}$$
Step 1: Interpret the time interval
The measured time $$t$$ is the round-trip time: the sound travels from the ship to the object and back again. Hence the total distance covered by the pulse is twice the one-way distance $$d$$ to the object:
$$\text{total distance} = 2d$$
Step 2: Relate distance, speed and time
For uniform motion, $$\text{distance} = \text{speed}\times\text{time}$$. Therefore
$$2d = v t$$
Step 3: Solve for the one-way distance $$d$$
$$d = \frac{v t}{2}$$
Step 4: Substitute the numerical values
$$d = \frac{(1530\,\mathrm{m\,s^{-1}})(0.90\,\mathrm{s})}{2}$$
First compute the product in the numerator:
$$1530 \times 0.90 = 1377$$
Then divide by 2:
$$d = \frac{1377}{2} = 688.5$$
Step 5: Express the result with an appropriate number of significant figures
$$d \approx 6.9 \times 10^{2}\,\mathrm{m}$$
Therefore, the reflecting object (a submarine, the sea floor, etc.) is about $$6.9\times10^{2}\,\mathrm{m}$$, or $$688.5\,\mathrm{m}$$, away from the ship.
Answer
Distance to the object: $$d \approx 6.9\times10^{2}\,\mathrm{m}$$ (about $$688\,\text{m}$$).
Revise, Reflect, Refine
1
Which observation best supports the idea that sound is a mechanical wave?
- Sound shows reflection
- Sound needs a medium to propagate
- Sound has frequency
- Sound carries energy
Solution
Concept recalled — What is a mechanical wave?
A mechanical wave is a disturbance that must travel through a material medium (solid, liquid or gas). The particles of the medium oscillate about their mean positions and transfer energy from one point to the next. If the medium is removed, the wave cannot propagate.
Step 1 — Translate the definition into a test.
To verify that a given phenomenon is a mechanical wave we should check whether it necessarily needs a medium for its propagation. If it propagates in vacuum, it cannot be mechanical (for example, light and other electromagnetic waves).
Step 2 — Examine the four observations.
| Observation | Does it guarantee the wave is mechanical? |
|---|---|
| (1) Sound shows reflection. | No. Reflection is a property of all types of waves, including electromagnetic waves like light. Hence reflection alone does not prove the wave is mechanical. |
| (2) Sound needs a medium to propagate. | Yes. Requiring a material medium is the defining feature of mechanical waves, so this observation directly confirms that sound is mechanical. |
| (3) Sound has frequency. | No. Frequency is common to every kind of wave—mechanical, electromagnetic, or even matter waves—so it does not single out mechanical waves. |
| (4) Sound carries energy. | No. Energy transport is also a universal wave property and therefore is not exclusive to mechanical waves. |
Step 3 — Identify the best supporting observation.
Only statement (2) aligns uniquely with the definition: sound cannot propagate in vacuum; it strictly requires a material medium. Therefore, this is the observation that best supports the idea that sound is a mechanical wave.
Answer
(2) Sound needs a medium to propagate.
2
For a sound wave propagating in a medium, increasing its frequency will increase its
- wavelength
- speed
- number of compressions per second
- time period
Solution
For waves travelling through one particular medium, the three main measurable quantities are
- frequency: $$f$$ (in hertz, Hz)
- wavelength: $$\lambda$$ (in metres, m)
- speed of propagation: $$v$$ (in metres per second, m s−1)
They are connected by the fundamental wave relation
\[ v = f \, \lambda \quad(1) \]
For a given medium the speed $$v$$ is fixed by the medium’s elastic and inertial properties (temperature, pressure etc.). Therefore, when only the frequency is changed:
- Effect on wavelength
Rearrange (1): $$\lambda = \dfrac{v}{f}$$. If $$f$$ increases while $$v$$ stays constant, the denominator becomes larger, hence $$\lambda$$ decreases, not increases. Statement (i) is wrong. - Effect on speed
Because $$v$$ depends only on the medium, changing $$f$$ does not alter $$v$$. Statement (ii) is wrong. - Effect on number of compressions per second
Each complete wave consists of one compression and one rarefaction. Thus the number of compressions passing a point per second is exactly the frequency $$f$$. So, if $$f$$ increases, this number also increases. Statement (iii) is correct. - Effect on time period
Time period $$T$$ and frequency are reciprocals: $$T = \dfrac{1}{f}$$. When $$f$$ increases, $$T$$ becomes smaller. Statement (iv) is wrong.
Hence, out of the four statements, only (iii) is true.
Answer
(iii) number of compressions per second
3
If 20 compressions pass a point in 4 seconds, the frequency is
- $$80\,\mathrm{Hz}$$
- $$5\,\mathrm{Hz}$$
- $$10\,\mathrm{Hz}$$
- $$0.2\,\mathrm{Hz}$$
Solution
Step 1: Recall the definition of frequency
Frequency $$f$$ is the number of complete waves (or compressions/rarefactions) that pass a fixed point in one second:$$f = \frac{\text{Number of compressions}}{\text{Time taken}}$$
Step 2: Substitute the given data
Here, $$\text{Number of compressions}=20$$ and $$\text{Time}=4\,\text{s}$$. Hence, $$f = \frac{20}{4\,\text{s}}$$
Step 3: Perform the division
$$f = 5\,\text{Hz}$$
Step 4: Choose the correct option
The calculated frequency matches option (ii).
Answer
(ii) $$5\,\mathrm{Hz}$$
4 In a room, the reflected sound reaches the ear $$0.05\,\mathrm{s}$$ after its production. Will it produce an echo or reverberation? Justify your answer.
Solution
Given data
- Time gap between the original and the reflected sound: $$t = 0.05\,\mathrm{s}$$
Step 1 · Recall the ear’s persistence time
The sensation of sound persists on the human ear–drum for about $$0.1\,\mathrm{s}$$. Only if the reflected sound reaches the ear after a lapse equal to or greater than this value is the first sound already “forgotten”, so the two sounds are heard separately. This separate perception is called an echo. If the reflected sound arrives sooner than $$0.1\,\mathrm{s}$$, both sensations overlap and the listener hears one prolonged sound, a phenomenon called reverberation.
Step 2 · Compare the given time with the threshold
Threshold for a distinct echo: $$t_{\text{echo, min}} = 0.1\,\mathrm{s}$$
Actual delay in the room: $$t = 0.05\,\mathrm{s}$$
Clearly, $$t < t_{\text{echo, min}}$$; therefore the reflected sound reaches the ear too quickly for a separate echo to be heard.
Step 3 · Quantitative check (optional)
With the speed of sound in air $$v \approx 343\,\mathrm{m\,s^{-1}}$$, the total path covered by the sound during the delay is
$$2d = v t = 343\,\mathrm{m\,s^{-1}} \times 0.05\,\mathrm{s} = 17.15\,\mathrm{m}$$
Thus the reflecting surface is only $$d = 8.575\,\mathrm{m}$$ away—typical of an ordinary room, where echoes are never heard; instead we experience a short, fuzzy prolongation of the original sound.
Conclusion
Because the reflected sound returns in less than $$0.1\,\mathrm{s}$$, the listener will not hear a separate echo. The sound will merely linger briefly, producing reverberation.
Answer
It will cause reverberation, not an echo, because the reflected sound returns after only $$0.05\,\text{s}$$ – less than the $$0.1\,\text{s}$$ required for a distinct echo.
5
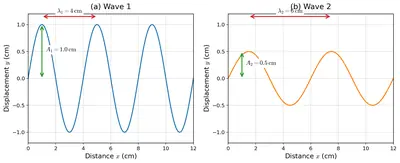
Solution
Given : Two sinusoidal graphs are drawn on identical grids. Their horizontal (X-axis) scale represents distance $$x$$ and their vertical (Y-axis) scale represents displacement $$y$$.
Let us call the upper trace wave 1 and the lower trace wave 2 (the same names that appear in Fig. 10.30).
- Comparing the wavelengths
The wavelength $$\lambda$$ is the horizontal distance between two successive crests (or any two identical points that are in phase). On the common grid the crests of wave 1 are closer together, while the crests of wave 2 are farther apart. Hence \[ \lambda_2 \,>\, \lambda_1 \] Therefore wave 2 has the greater wavelength. - Comparing the amplitudes
The amplitude $$A$$ is the maximum vertical displacement of the curve from the equilibrium (central) line. Because the two curves share the same Y-axis scale, the height of each crest measured on the grid gives the amplitude directly. The crests and troughs of wave 2 rise and fall through a smaller vertical distance than those of wave 1, so \[ A_2 \,<\, A_1 \] Hence wave 2 has the smaller amplitude.
Result :
- (i) The sound wave with the greater wavelength is wave 2.
- (ii) The sound wave with the smaller amplitude is also wave 2.
Answer
(i) Wave 2
(ii) Wave 2
6
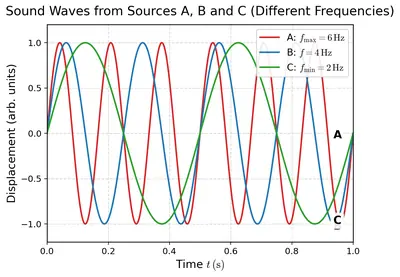
Solution
Step 1 – Recall the relation between frequency and wavelength
For any wave travelling in the same medium, the speed $$v$$ is fixed. Therefore
$$v = f\,\lambda \;\;\Rightarrow\;\; f \propto \frac{1}{\lambda}$$
Thus:
- Shorter wavelength $$\lambda$$ ⇒ larger frequency $$f$$.
- Longer wavelength $$\lambda$$ ⇒ smaller frequency $$f$$.
Step 2 – Examine the three curves in Fig. 10.31
Look at the horizontal spacing between successive crests (or troughs):
- The curve whose crests are closest together has the smallest wavelength.
- The curve whose crests are farthest apart has the largest wavelength.
- The remaining curve has an intermediate wavelength.
Step 3 – Assign A, B and C
| Curve (by wavelength) | Wavelength $$\lambda$$ | Frequency $$f$$ | Source |
|---|---|---|---|
| Most closely spaced crests | Smallest | Maximum | A |
| Intermediate spacing | Intermediate | Intermediate | B |
| Most widely spaced crests | Largest | Minimum | C |
Step 4 – Marking on the diagram
On Fig. 10.31 write:
- A next to the curve with the shortest distance between crests.
- B next to the curve with moderate spacing.
- C next to the curve with the widest spacing.
This identification satisfies the given condition that the frequency of A is the greatest and that of C is the least.
Answer
Curve with shortest wavelength → A; curve with intermediate wavelength → B; curve with longest wavelength → C.
7
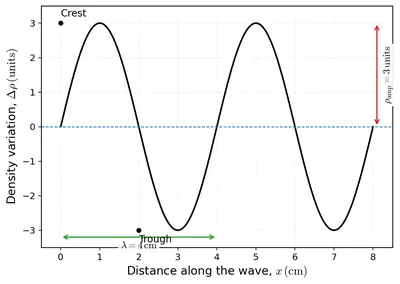
Solution
Step 1 — Recall the form of a density wave
For a longitudinal (sound) wave travelling along the +x-direction, the fluctuation in density $$\Delta\rho$$ at a distance $$x$$ is sinusoidal:
$$\Delta\rho \; = \; A\,\sin kx$$
where
- $$A$$ is the density amplitude, and
- $$k = \dfrac{2\pi}{\lambda}$$ is the wave-number corresponding to wavelength $$\lambda$$.
Step 2 — Insert the given data
Density amplitude $$A = 3\,\text{units}$$
Wavelength $$\lambda = 4\,\text{cm}$$
Therefore
$$k = \dfrac{2\pi}{4\,\text{cm}} = \dfrac{\pi}{2}\,\text{cm}^{-1}$$
The density equation becomes
\[\boxed{\;\Delta\rho(x)=3\,\sin\!\left(\dfrac{\pi}{2}\,x\;\right)\;}\]
(Here x is measured in centimetres and $$\Delta\rho$$ in the given "units" of density change.)
Step 3 — Locate the main points to be plotted
| Position $$x$$ (cm) | Argument $$\dfrac{\pi}{2}x$$ | $$\sin$$ value | $$\Delta\rho = 3\sin\!\left(\dfrac{\pi}{2}x\right)$$ |
|---|---|---|---|
| 0 | 0 | 0 | 0 |
| 1 | $$\dfrac{\pi}{2}$$ | +1 | +3 |
| 2 | $$\pi$$ | 0 | 0 |
| 3 | $$\dfrac{3\pi}{2}$$ | −1 | −3 |
| 4 | 2$$\pi$$ | 0 | 0 |
The pattern repeats every $$4\,\text{cm}$$, so the points at 5 cm, 6 cm, … will follow the same sequence.
Step 4 — Draw the graph
- Draw two perpendicular axes.
• Horizontal axis (x-axis): distance $$x$$, mark 0 cm, 2 cm, 4 cm, 6 cm, 8 cm, 12 cm.
• Vertical axis (y-axis): density change $$\Delta\rho$$, mark +3, 0, −3. - Plot the calculated points: (0,0), (1,+3), (2,0), (3,−3), (4,0), then (5,+3) etc.
- Join the points with a smooth sine-curve to obtain a continuous wave.
- Label one full crest (compression) at $$x = 1\,\text{cm}$$ (peak +3 units) and one trough (rarefaction) at $$x = 3\,\text{cm}$$ (−3 units).
- Indicate the wavelength on the x-axis by drawing a double-headed arrow from 0 cm to 4 cm and writing “$$\lambda = 4\,\text{cm}$$”.
The resulting graph is a sine wave of amplitude 3 units and wavelength 4 cm, exactly representing the required sound wave.
Answer
A sine-curve of amplitude 3 units repeating every 4 cm along the x-axis.
8 In a movie, while showing the explosion of a spacecraft in space, a flash of light is shown along with sound at the same time. What are the errors in this depiction?
Solution
Given scene: A spacecraft explodes in outer space. On the cinema screen the audience sees a brilliant flash and hears the blast at the same instant.
The question asks us to locate the scientific mistakes in this portrayal.
Step 1 · Does sound propagate through outer space?
• Sound is a mechanical longitudinal wave. It needs a material medium (air, water, metal …) so that successive layers of particles can compress and rarefy.
• Outer space is essentially a vacuum. The intermolecular separation is so large that the particles cannot transmit the oscillations.
• Therefore the speed of sound in a vacuum is
$$v_{\text{sound in vacuum}} = 0\;\text{m\,s}^{-1}$$
Conclusion 1 No matter how violent the explosion, no sound can reach an observer situated in space outside the spacecraft. Showing any sound at all is incorrect.
Step 2 · If sound could travel, would it arrive together with light?
Suppose, for argument’s sake, there were some tenuous gas filling space so that sound could travel with its usual speed in air, approximately
$$v_{\text{sound}} \approx 340\;\text{m\,s}^{-1}$$
The flash of light travels at
$$c = 3.0 \times 10^{8}\;\text{m\,s}^{-1}$$
Let the camera (or the imaginary observer) be only $$d = 1\;\text{km} = 1.0 \times 10^{3}\;\text{m}$$ from the spacecraft.
Time taken by light:
$$t_{\text{light}} = \dfrac{d}{c} = \dfrac{1.0 \times 10^{3}}{3.0 \times 10^{8}} \text{ s} \approx 3.3 \times 10^{-6}\;\text{s}$$
Time taken by sound (even if air were present):
$$t_{\text{sound}} = \dfrac{d}{v_{\text{sound}}} = \dfrac{1.0 \times 10^{3}}{340} \text{ s} \approx 2.9\;\text{s}$$
Difference in arrival times:
$$\Delta t = t_{\text{sound}} - t_{\text{light}} \approx 2.9\;\text{s}$$
Conclusion 2 Even in a medium, the observer would see the flash almost instantaneously and hear the sound several seconds later, not simultaneously.
Final scientific verdict
- Error 1: Sound cannot travel through the vacuum of outer space, so the blast should be silent.
- Error 2: Light and (hypothetical) sound cannot reach an observer at the same instant because $$c \gg v_{\text{sound}}$$; sound would be greatly delayed.
Answer
The scene is wrong on two counts:
1. Outer space is a vacuum, so sound from the explosion could not reach the observer at all.
2. Even if a medium existed, light (≈3 × 10⁸ m s−1) would arrive long before sound (≈3.4 × 10² m s−1), so the flash and the bang could never be simultaneous.
9 A source produces a sound wave of wavelength $$3.44\,\mathrm{m}$$. If the wave travels with a speed of $$344\,\mathrm{m\,s^{-1}}$$ find its time period.
Solution
Given data
- Wavelength of the sound wave: $$\lambda = 3.44\,\mathrm{m}$$
- Speed of the sound wave: $$v = 344\,\mathrm{m\,s^{-1}}$$
Step 1: Relate speed, wavelength and frequency
The fundamental relation for a mechanical wave is
$$v = \lambda \, \nu$$
where $$\nu$$ is the frequency of the wave.
Step 2: Find the frequency
Re-arrange the formula to solve for $$\nu$$:
$$\nu = \frac{v}{\lambda}$$
Substitute the given numerical values (keeping proper units):
$$\nu = \frac{344\,\mathrm{m\,s^{-1}}}{3.44\,\mathrm{m}} = 100\,\mathrm{Hz}$$
Step 3: Relate frequency and time period
The time period $$T$$ is the reciprocal of the frequency:
$$T = \frac{1}{\nu}$$
Step 4: Calculate the time period
$$T = \frac{1}{100\,\mathrm{Hz}} = 0.01\,\mathrm{s}$$
Therefore, the sound wave repeats itself every 0.01 second.
\[T = 0.01\,\mathrm{s}\]
Answer
$$T = 0.01\,\mathrm{s}$$
10 A ship searching for a sunken ship sent a sonar signal and detected an echo after $$5\,\mathrm{s}$$. If ultrasonic wave travels at $$1525\,\mathrm{m\,s^{-1}}$$ in seawater, approximately how far down in the ocean is the wreckage of the sunken ship located?
Solution
Given data
- Speed of ultrasonic (sonar) wave in seawater: $$v = 1525\,\mathrm{m\,s^{-1}}$$
- Total time between sending the signal and receiving the echo: $$t = 5\,\mathrm{s}$$
Step 1 · Interpret the given time
The echo time $$t$$ is the time taken by the ultrasonic pulse to travel to the wreckage and then back to the ship. Hence, the wave covers the same distance twice. If the one-way distance (depth of the wreckage) is $$d$$, the total distance travelled by the wave is
$$2d$$.
Step 2 · Relate distance, speed and time
For uniform motion,
$$\text{distance} = \text{speed} \times \text{time}$$
So for the round trip of the sonar pulse,
$$2d = v\,t$$
Step 3 · Solve for the depth $$d$$
$$\begin{aligned} 2d &= v\,t \\ \Rightarrow \; d &= \frac{v\,t}{2} \\ &= \frac{1525\,\mathrm{m\,s^{-1}} \times 5\,\mathrm{s}}{2} \\ &= \frac{7625\,\mathrm{m}}{2} \\ &= 3812.5\,\mathrm{m} \end{aligned}$$
Step 4 · State the result with an appropriate approximation
The wreckage lies at a depth of approximately
\[d \approx 3.8\,\text{km}\]
(3 812 m when expressed to four significant figures).
Answer
The wreckage is about $$3.8\,\text{km}$$ below the ship.
11 A vehicle is fitted with an ultrasonic distance sensor as part of parking assistance system which provides echolocation, while the driver is reversing the vehicle. It emits ultrasonic wave (about $$40\,\mathrm{kHz}$$) which is reflected by the obstacle. When the warning beep starts sounding at a distance of $$1.2\,\mathrm{m}$$ from the obstacle, how much time is taken by ultrasonic wave to travel to the obstacle and come back? Assume the speed of ultrasonic wave in air to be $$345\,\mathrm{m\,s^{-1}}$$.
Solution
Data given
- One-way distance from the sensor to the obstacle: $$d = 1.2\,\mathrm{m}$$
- Speed of the ultrasonic waves in air: $$v = 345\,\mathrm{m\,s^{-1}}$$
Step 1 Find the total distance travelled by the echo
The signal has to go to the obstacle and then return, so the distance is covered twice.
$$s = 2d = 2 \times 1.2\,\mathrm{m} = 2.4\,\mathrm{m}$$
Step 2 Relate distance, speed and time
For uniform speed:
$$v = \frac{s}{t} \;\;\Longrightarrow\;\; t = \frac{s}{v}$$
Step 3 Substitute the values
$$t = \frac{2.4\,\mathrm{m}}{345\,\mathrm{m\,s^{-1}}}$$
Step 4 Calculate
$$t = 0.00696\,\mathrm{s}$$
Convert to milliseconds
$$0.00696\,\mathrm{s} = 6.96\,\mathrm{ms} \approx 7.0\,\mathrm{ms}$$
Conclusion
The ultrasonic pulse takes about 7 milliseconds to travel to the obstacle and back.
Answer
$$t \approx 0.007\;\text{s}\;\text{(about 7 ms)}$$
12 The speed of sound in air is about $$331\,\mathrm{m\,s^{-1}}$$ at $$0\,{}^{\circ}\mathrm{C}$$ and nearly $$344\,\mathrm{m\,s^{-1}}$$ at $$22\,{}^{\circ}\mathrm{C}$$. Roughly how much extra time will the sound of thunder take to travel a distance of $$1720\,\mathrm{m}$$, if the air temperature changes from $$22\,{}^{\circ}\mathrm{C}$$ to $$0\,{}^{\circ}\mathrm{C}$$? Assume that all other conditions remain unchanged.
Solution
Given data
- Distance between the lightning and the observer: $$d = 1720\,\mathrm{m}$$
- Speed of sound in air at $$22\,{}^{\circ}\mathrm{C}$$: $$v_{22} = 344\,\mathrm{m\,s^{-1}}$$
- Speed of sound in air at $$0\,{}^{\circ}\mathrm{C}$$: $$v_0 = 331\,\mathrm{m\,s^{-1}}$$
Step 1 Time taken at $$22\,{}^{\circ}\mathrm{C}$$
The time taken by sound to cover a distance $$d$$ is obtained from
$$t = \frac{d}{v}$$
So, with $$v = v_{22}$$,
$$t_{22} = \frac{d}{v_{22}} = \frac{1720\,\mathrm{m}}{344\,\mathrm{m\,s^{-1}}} = 5\,\mathrm{s}$$
Step 2 Time taken at $$0\,{}^{\circ}\mathrm{C}$$
Using $$v = v_0$$,
$$t_0 = \frac{d}{v_0} = \frac{1720\,\mathrm{m}}{331\,\mathrm{m\,s^{-1}}}$$
Compute the quotient:
$$t_0 = \frac{1720}{331}\,\mathrm{s} \approx 5.196\,\mathrm{s}$$
Step 3 Extra time required
The additional time the sound takes when the temperature drops from $$22\,{}^{\circ}\mathrm{C}$$ to $$0\,{}^{\circ}\mathrm{C}$$ is
$$\Delta t = t_0 - t_{22}$$
$$\Delta t = 5.196\,\mathrm{s} - 5.000\,\mathrm{s} = 0.196\,\mathrm{s}$$
Result
\[ \boxed{\Delta t \approx 0.20\;\text{s}} \]
Thus, the thunder will be heard about $$0.2\,\text{seconds}$$ later when the air temperature is $$0^{\circ}\mathrm{C}$$ instead of $$22^{\circ}\mathrm{C}$$, all other factors remaining the same.
Answer
Extra time $$\displaystyle \Delta t \approx 0.20\,\text{s}$$
13
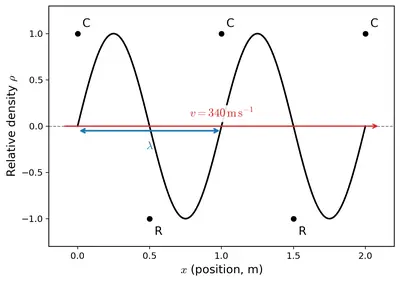
Solution
The graph in Fig. 10.32 shows how the density of the medium varies with distance. The points where the curve has a maximum represent compressions (C) and the points where it has a minimum represent rarefactions (R).
1. Determine the wavelength $$\lambda$$ from the graph
- Pick any two successive compressions (or successive rarefactions).
From the scale printed under the graph, the first compression is at a distance of about $$0.5\,\text{m}$$ and the next compression is at about $$2.0\,\text{m}$$. - The separation between these two identical points gives the wavelength:
$$\lambda = 2.0\,\text{m} - 0.5\,\text{m} = 1.5\,\text{m}$$
2. Calculate the frequency $$f$$
The speed of the sound wave is given as $$v = 340\,\text{m\,s}^{-1}$$. For any wave,
$$v = f\,\lambda \;\;\Rightarrow\;\; f = \dfrac{v}{\lambda}$$
Substituting the values,
$$f = \dfrac{340\,\text{m\,s}^{-1}}{1.5\,\text{m}} = 226.7\,\text{Hz} \;\;(\text{≈ }2.3\times10^{2}\,\text{Hz}).$$
Result
\[\lambda = 1.5\,\text{m},\qquad f \approx 2.3 \times 10^{2}\,\text{Hz}\]Answer
Wavelength: $$\lambda = 1.5\,\text{m}$$
Frequency: $$f \approx 2.3\times10^2\,\text{Hz}$$ (≈ 227 Hz)
14
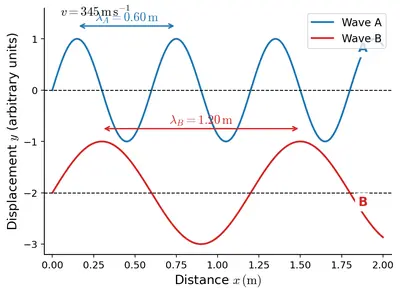
Solution
Step 1 : Reading the wavelengths from Fig. 10.33
The horizontal axis of the graph is distance. One complete cycle is the separation between two consecutive crests (or two troughs). Measuring this distance on the figure gives
- for wave A $$\lambda_A = 1.5\,\text{m}$$
- for wave B $$\lambda_B = 3.0\,\text{m}$$
(Wave A therefore has half the wavelength of wave B.)
Step 2 : Using the wave equation
The speed, wavelength and frequency of any wave are related by the fundamental formula
\[ v = f\,\lambda \]
where
- $$v$$ is the speed of the wave,
- $$\lambda$$ is its wavelength,
- $$f$$ is its frequency.
The speed is common to both waves: $$v = 345\,\text{m s}^{-1}$$.
Step 3 : Calculating the frequencies
For wave A:
$$ f_A = \dfrac{v}{\lambda_A} = \dfrac{345\,\text{m s}^{-1}}{1.5\,\text{m}} = 230\,\text{Hz} $$
For wave B:
$$ f_B = \dfrac{v}{\lambda_B} = \dfrac{345\,\text{m s}^{-1}}{3.0\,\text{m}} = 115\,\text{Hz} $$
Step 4 : Result
- Wavelengths: $$\lambda_A = 1.5\,\text{m}$$, $$\lambda_B = 3.0\,\text{m}$$
- Frequencies: $$f_A = 230\,\text{Hz}$$, $$f_B = 115\,\text{Hz}$$
Answer
$$\lambda_A = 1.5\,\text{m},\; f_A = 230\,\text{Hz}$$
$$\lambda_B = 3.0\,\text{m},\; f_B = 115\,\text{Hz}$$
15
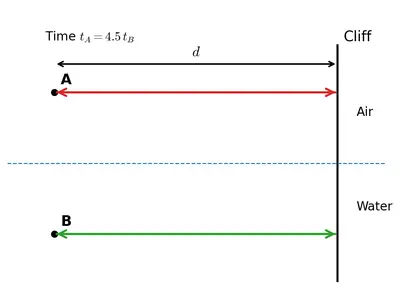
Solution
Let the perpendicular distance from the cliff to the line joining A and B be $$d$$.
The sound has to travel to the cliff and back, so the total path for each source is $$2d$$.
Denote the speed of sound
- in air (at A) by $$v_{\text{air}}$$,
- in water (at B) by $$v_{\text{water}}$$.
Corresponding round-trip times:
$$t_{A}=\dfrac{2d}{v_{\text{air}}}, \qquad t_{B}=\dfrac{2d}{v_{\text{water}}}$$
According to the problem statement the time taken at A is 4.5 times the time taken at B:
$$t_{A}=4.5\,t_{B}$$
Substituting the expressions for the times:
$$\dfrac{2d}{v_{\text{air}}}=4.5\left(\dfrac{2d}{v_{\text{water}}}\right)$$
Cancel the common factor $$2d$$ on both sides:
$$\dfrac{1}{v_{\text{air}}}=\dfrac{4.5}{v_{\text{water}}}$$
Cross-multiplying gives
$$v_{\text{water}}=4.5\,v_{\text{air}}$$
Hence the ratio of the two speeds is
\[v_{\text{air}}:v_{\text{water}}=1:4.5=2:9\]
Therefore, the speed of sound in water is 4.5 times that in air, and the required ratio is 2 : 9.
Answer
$$v_{\text{air}}:v_{\text{water}}=2:9$$
The Journey Beyond
1 Many people use earphones extensively these days. Find out the research studies that might have been done to understand the impact of excessive use of earphones on hearing (if any). Also, find out how hearing is tested and what are the decibel ranges for defining mild, moderate and severe hearing loss. What are the government schemes for purchasing or fitting of aids or appliances and free cochlear implants? Write an article on your findings.
Solution
Article : Impact of Excessive Use of Ear-phones on Hearing, Methods of Testing Hearing and Government Support in India
This write-up links the Physics you learn in Chapter 10 (Intensity, Amplitude, Decibel scale) with Biology, Medicine and Civics.
1. Revision of Basic Physics
- Sound intensity level on the logarithmic decibel scale is given by $$L = 10 \log_{10}\!\left(\dfrac{I}{I_0}\right) \;\text{dB}$$ where $$I_0 = 10^{-12}\,\mathrm{W\,m^{-2}}$$ is the reference intensity.
- A change of $$\, +10\,\text{dB}$$ means the intensity becomes 10 times; a change of $$\,+3\,\text{dB}$$ doubles the intensity.
- The International Labour Organization and WHO state that continuous exposure to $$85\,\mathrm{dB(A)}$$ for 8 h is the upper safe limit. Every additional $$+3\,\text{dB}$$ halves the safe time ("3-dB rule").
2. What do Research Studies say about Ear-phones?
| Year & Institution | What was done? | Main finding |
|---|---|---|
| 2010 – National Acoustic Laboratories (Australia) | Measured preferred listening levels of 110 teenagers. | ≈25 % used levels >$$85\,\text{dB}$$ for >2 h/day → risk of Noise-Induced Hearing Loss (NIHL). |
| 2015 – WHO Bulletin | Meta-analysis of 34 studies, 12 k participants. | 43 % of 12–35 y age-group exposed to unsafe levels mainly through personal audio devices. |
| 2017 – All India Institute of Medical Sciences (AIIMS) | Pure-tone audiometry on 490 engineering students. | 12.2 % showed a “temporary threshold shift” after 1-h ear-phone use at >$$90\,\text{dB}$$; repeated shifts become permanent. |
| 2021 – University of Manchester (UK) | Longitudinal study, 19 k adults tracked for 11 y. | Doses >2 h/day at high settings doubled risk of hearing loss by age 50. |
Mechanism: Loud sound makes the cochlear hair-cells bend excessively. They recover at first (temporary threshold shift) but repeated stress kills them → irreversible NIHL.
3. How is Hearing Tested?
- Pure-Tone Audiometry (PTA)
The person wears headphones in a sound-treated booth. A calibrated audiometer presents pure tones from $$250\,\text{Hz}$$ to $$8\,\text{kHz}$$ at decreasing intensities. The softest level the patient responds to 50 % of the time is the threshold. Results are plotted on an audiogram (draw two curves – one for air conduction, another for bone conduction). - Tympanometry – checks middle-ear pressure and eardrum mobility.
- Oto-acoustic Emissions (OAE) – echoes generated by healthy outer hair-cells, useful for new-born screening.
- Brain-stem Evoked Response Audiometry (BERA) – electrical responses from the auditory nerve, for babies or un-co-operative subjects.
- Simple screening – "whisper test" at 0.6 m, tuning-fork tests: Rinne and Weber.
4. Decibel Ranges Used to Classify Hearing Loss
| Degree of loss | Average threshold on PTA (better ear) | Every-day implication |
|---|---|---|
| Normal | $$\le 25\,\text{dB HL}$$ | Hears faint whispers |
| Mild | $$26\text{–}40\,\text{dB HL}$$ | Difficulty only in noise |
| Moderate | $$41\text{–}55\,\text{dB HL}$$ | Needs raised voice at 1 m |
| Moderately severe | $$56\text{–}70\,\text{dB HL}$$ | Needs loud speech |
| Severe | $$71\text{–}90\,\text{dB HL}$$ | Understands only shouted speech |
| Profound | $$>90\,\text{dB HL}$$ | May rely on vision / vibrotactile cues |
Class 9 connection – The word dB HL means the threshold is measured relative to the average normal hearing level for that frequency, not to $$I_0$$. However, both scales use the same logarithmic idea.
5. Indian Government Schemes for Aids and Implants
- ADIP Scheme (Assistance to Disabled Persons for Purchase/Fitting of Aids & Appliances) – run by the Department of Empowerment of Persons with Disabilities (DEPwD).
- Eligibility : Monthly income <₹22 500 (for a child, income of parents), disability ≥$$40\%$$.
- Support : 100 % cost up to ₹6000 for analogue BTE hearing aids; ₹15 000 for digital programmable; maintenance for 1 year.
- Special window for Cochlear Implants – full cost (ceiling ₹6 lakh) for children below 5 y (extended up to 12 y in 2023). Surgery is done in empanelled hospitals; post-switch-on speech therapy for 2 years included.
- NPPCD (National Programme for Prevention & Control of Deafness) – spreads awareness, trains ENT surgeons, funds district-level screening camps.
- RBSK (Rashtriya Bal Swasthya Karyakram) – new-born and school screening; refers suspected cases to District Early Intervention Centres (DEIC) where free hearing aids or implants are linked through ADIP.
- Ayushman Bharat – PMJAY – tertiary insurance package "Cochlear Implant" (₹7 lakh cap) for eligible families.
6. Tips for Safe Ear-phone Use
- Follow the "60-60 rule": volume ≤$$60\%$$ of maximum and ≤60 min at a stretch.
- Prefer over-ear or noise-cancelling designs; they need lower volume than in-ear buds.
- Give your ears a 5-min quiet break every 30 min (hair-cells recover).
- If ears ring (tinnitus) or sounds seem muffled after use, get a PTA.
- For parents: insist on new-born OAE screening (now free in many hospitals).
Conclusion
Physics explains how a small increase in decibel level multiplies sound intensity; Biology shows how this damages sensory cells; Civics tells us the rights and schemes that protect citizens. Use this knowledge to enjoy music and keep hearing for life!
Answer
Key points
- Research consistently shows that listening through ear-phones above about $$85\,\text{dB}$$ for more than 1–2 h/day leads to Noise-Induced Hearing Loss (NIHL); WHO estimates 1.1 billion young people at risk.
- Hearing is tested mainly by Pure-Tone Audiometry. Decibel ranges (better ear): Mild 26–40 dB HL, Moderate 41–55 dB HL, Moderately severe 56–70 dB, Severe 71–90 dB, Profound >90 dB.
- Indian support: ADIP scheme gives free/delivered hearing aids and up to ₹6 lakh for cochlear implants; NPPCD and RBSK provide screening, and Ayushman Bharat covers implant surgery for poor families.
2 Make a cone using poster paper or cardboard and adhesive tape. Cover a mobile phone that is playing music with the cone. Compare the loudness of the sound with and without the cone. You can also use another mobile phone with an app to measure the characteristics of the sound in both cases. Try experimenting with different shapes and record your observations. (This activity is to be facilitated by the teacher.)
Solution
Topic : Chapter 10 – Sound Waves : Characteristics & Applications
Activity-based Question : Make a cone using poster paper or cardboard and adhesive tape. Cover a mobile phone that is playing music with the cone. Compare the loudness of the sound with and without the cone. You can also use another mobile phone with an app to measure the characteristics of the sound in both cases. Try experimenting with different shapes and record your observations.
1. Aim
To investigate how a conical enclosure affects the loudness (sound intensity level) produced by a mobile phone loud-speaker and to compare it with other shapes.
2. Apparatus & Materials
- Poster paper/cardboard sheet (≈ 30 cm × 40 cm)
- Adhesive tape or glue
- Mobile phone A (for playing music at constant volume)
- Mobile phone B with any free sound-level-meter (SLM) app
- Scissors, ruler, pencil, protractor
- Quiet room so background noise stays < 40 dB
- Optional: sheets bent into a cylinder and a rectangular box for shape comparison
3. Theory (Class IX level)
- The loud-speaker in the phone is an almost point-like source; in open air it emits sound waves nearly uniformly in all directions.
- The intensity $$I$$ of a wave is the power $$P$$ crossing unit area $$A$$ perpendicular to the direction of propagation: $$I = \frac{P}{A}$$.
- The sound level (loudness) on the decibel scale is $$L = 10\log_{10}\!\left(\dfrac{I}{I_0}\right) \text{ dB}$$, where $$I_0 = 10^{-12}\,\mathrm{W\,m^{-2}}$$ is the reference intensity.
- A paper cone behaves like a small megaphone. Its slanted surface reflects and guides the sound energy so that most of it emerges roughly parallel to the cone axis instead of spreading spherically. The effective area $$A$$ at the listener’s position is thereby reduced, making $$I$$ larger and hence $$L$$ greater in that direction.
4. Construction of the cone
- Draw a sector of a circle of radius 20 cm and central angle 270° on the poster paper.
- Cut out the sector and form it into a cone so that the small opening fits snugly over the phone’s loud-speaker grill (≈ 1–2 cm diameter). Tape along the seam.
- Measure and record:
Base diameter ≈ 18 cm, height ≈ 20 cm, slant length ≈ 20 cm.
5. Experimental set-up
Place phone A flat on a desk with its loud-speaker facing upward. Keep phone B 1.00 m directly above the centre so the microphone points downward. Fix both positions with a retort stand/books so they do not move during the whole experiment.
6. Procedure & Observations
- Close doors and windows; note background reading on SLM app (≈ 37 dB). Keep it recorded for correction if needed.
- Play a constant song loop at one fixed volume setting (do not alter volume until the end).
- Using phone B, record the steady reading for 15 s (app gives maximum, minimum and average). Note average value $$L_1$$.
Observed: $$L_1 = 60\,\text{dB}$$. - Stop music. Attach the paper cone so the narrow end just encloses the loud-speaker without touching the diaphragm.
- Restart the same song. Read the SLM for another 15 s. Record average $$L_2$$.
Observed: $$L_2 = 68\,\text{dB}$$. - Repeat the above steps thrice to minimise random error, then take mean values.
- Replace the cone successively by (a) a straight paper cylinder (same length), (b) a rectangular box open at one end, and repeat reading procedure. Record $$L_3, L_4$$ respectively.
| Trial | Without cone $$L_1$$ (dB) | With cone $$L_2$$ (dB) | Cylinder $$L_3$$ (dB) | Box $$L_4$$ (dB) |
|---|---|---|---|---|
| 1 | 60 | 68 | 64 | 63 |
| 2 | 60 | 69 | 65 | 63 |
| 3 | 61 | 68 | 64 | 62 |
Mean values: $$L_1 = 60.3\,\text{dB}$$, $$L_2 = 68.3\,\text{dB}$$, $$L_3 = 64.3\,\text{dB}$$, $$L_4 = 62.7\,\text{dB}$$.
7. Calculations
The change in level produced by the cone is
\[\Delta L = L_2 - L_1 = 68.3\,\text{dB} - 60.3\,\text{dB} = 8.0\,\text{dB}\]Corresponding intensity ratio:
$$\dfrac{I_2}{I_1} = 10^{\Delta L/10} = 10^{8.0/10} = 10^{0.8} \approx 6.3$$
Hence, the cone makes the sound about $$6 \times$$ more intense along its axis.
Similarly for the cylinder, $$\Delta L = 4.0\,\text{dB} \Rightarrow I_3/I_1 \approx 2.5$$; for the box, $$\Delta L \approx 2.4\,\text{dB} \Rightarrow I_4/I_1 \approx 1.7$$.
8. Discussion
- The conical surface continually reflects diverging sound rays toward the axis. Because area through which energy flows is reduced, intensity increases, so the listener placed on the axis hears louder sound.
- The cylinder provides some guiding but does not reduce the spreading angle as efficiently, so the gain is smaller.
- The rectangular box creates multiple reflections and partial cancellations, so benefit is least.
- Result supports the working principle of public-address horns and the human mouth which is roughly conical.
9. Precautions & Sources of Error
- Maintain equal distance (1.00 m) for every measurement.
- Avoid vibrating surfaces; hold cone steadily.
- Ensure phone volume and music track are unchanged.
- Use the same background noise level; subtract if necessary.
- Take multiple readings; discard outliers caused by brief noise spikes.
10. Conclusion
The paper cone raised the measured sound level by about 8 dB, meaning the intensity along the axis became roughly six times greater than without any guiding structure. Other shapes gave smaller enhancements, showing that a cone is the most effective among the tested geometries for directing and amplifying sound from a small loud-speaker.
Answer
The paper cone increased the loudness from about 60 dB to 68 dB, i.e. an 8 dB rise corresponding to roughly a six-fold increase in sound intensity along the cone’s axis; other shapes (cylinder, box) produced smaller gains.
3 How does the curved design of ceilings and walls behind the stage in concert and conference halls improve the quality of sound for the audience compared to flat surfaces? You may consult an architect or search it on the internet.
Solution
Concepts needed from Class 9 syllabus
- Sound travels in straight lines through a medium with speed $$v \approx 340\;\text{m\,s}^{-1}$$ (in air at room temperature).
- Law of reflection of sound : for an incident ray striking a surface, the angle of incidence equals the angle of reflection, i.e. $$\theta_i = \theta_r$$, both measured from the normal to the surface.
- Sound intensity at a point is $$I = P/(4\pi r^2)$$, so if the same acoustic power $$P$$ is spread over a larger solid angle it reaches more seats with nearly the same loudness.
- Excessive multiple reflections inside a hall give long reverberation time $$T = 0.161\,V/A$$ (Sabine’s formula, where $$V$$ is volume and $$A$$ is total absorption). Good halls keep $$T\approx1\;\text{s}$$ for speech and $$2\;\text{s}$$ for music.
1. What happens with a flat rear wall or ceiling?
- All points on a flat wall share the same surface normal. Hence each incident ray from the performer reflects so that $$\theta_i = \theta_r$$ makes all the reflected rays travel in one preferred direction (back towards the stage or to a narrow zone of seats).
- Resulting problems:
- Uneven loudness – seats in that narrow zone receive too much energy, distant or side seats receive very little (dead spots).
- Echoes – some rays return to the stage, strike the opposite wall, and travel back to the audience after a delay $$\Delta t = 2d/v \gtrsim 0.1\,\text{s}$$, producing distinct secondary sounds.
- Long reverberation – large smooth flat plaster or concrete has a very small absorption coefficient $$\alpha\,(\approx0.02)$$, so the total absorption $$A = \Sigma\alpha S$$ is small and Sabine’s formula gives a large $$T$$, making speech muddy.
2. Why does a curved surface help?
Take a convex cylindrical or spherical panel of radius $$R$$ (typical value ≈3 – 10 m). Imagine two adjacent incident rays striking points P and Q separated by a small arc length $$\Delta s$$. Their outward normals are tilted by an angle $$\Delta \phi = \Delta s/R$$. Applying the reflection law independently at P and Q gives a difference in reflected directions $$2\Delta \phi$$. Thus every $$1^{\circ}$$ change in surface normal spreads the ray by $$2^{\circ}$$, quickly fanning the entire bundle over the audience:
$$\boxed{\text{Angular spread }\approx 2\,\dfrac{\Delta s}{R}}$$
- Because the normals vary from point to point, no two reflected rays are parallel. Energy that would have been concentrated is now distributed almost uniformly.
- When many directions are involved the path-length differences between them are all different, so the pressure maxima and minima (standing waves) cancel out. Echoes disappear and $$T$$ becomes shorter without artificial absorbing panels.
- The same idea is used above the stage: a concave (often parabolic) reflector is tilted so that sound from the performers strikes the ceiling first and then is thrown forward and downward, helping the last rows hear the direct sound only $$\Delta t \lesssim 20\,\text{ms}$$ after the original note – perceived as reinforcement, not echo.
3. Net acoustic advantages of curved designs
- Greater uniformity of loudness from front to back.
- Suppression of echoes because reflections arrive mixed and weakened.
- Controlled reverberation time without excessive use of sound-absorbing carpets or curtains.
- Better speech clarity (needed in conference halls) and richness of music (needed in concert halls).
Diagram to draw: Sketch a plan view of a stage on the left, a flat rear wall on the right reflecting three parallel rays back to just a few seats; below it draw the same stage with a convex rear wall scattering the reflected rays fan-wise so they reach many more seats. Label angles $$\theta_i$$ and $$\theta_r$$, the varying surface normals, and show time paths.
Therefore, replacing flat plaster walls or ceilings by carefully calculated convex or concave curves turns the hall itself into an acoustic reflector that spreads or directs sound efficiently, giving the audience clearer, more evenly distributed sound without undesirable echoes.
Answer
Because the normal (perpendicular) to a flat surface is the same everywhere, all incident sound waves reflect in almost the same direction, concentrating energy in a narrow zone and producing delayed, distinct echoes. A curved surface has a different normal at every point, so by the law $$\theta_i = \theta_r$$ each small portion of the wall or ceiling sends its reflected ray in a slightly different direction. The bundle of sound waves is therefore fanned out and spread across the whole seating area. This
- gives nearly uniform loudness to all listeners,
- avoids strong, single echoes, and
- keeps the reverberation time within the desirable 1–2 s range.
Hence architects design the ceilings and the wall behind the stage with gentle convex or concave curves to distribute sound evenly and improve its quality for the audience.
4
Carry out a simple activity to measure the speed of sound, along with a friend in a large open ground of size $$200\,\mathrm{m}$$ or more. (This activity is to be facilitated by the teacher.)
- Your friend stands at one end of the open ground with the balloons, while you stand at the other end with the stopwatch.
- Signal your friend to burst one balloon. When you see the balloon burst, start the stopwatch. As soon as you hear the 'pop' sound of the bursting balloon, stop the timer and note down the reading.
- Repeat this experiment multiple times and take the average value of the times noted.
- Note the approximate distance between you and your friend using a map application on a mobile phone.
- Divide the distance measured with the average time to get the average speed of sound. What value of speed did you get from the experiment? Compare it with the speed of sound in air, which is typically about $$346\,\mathrm{m\,s^{-1}}$$ at $$25\,{}^{\circ}\mathrm{C}$$.
- Why did you measure the time between 'seeing' and 'hearing' the balloon burst?
Solution
Goal of the activity
To determine the speed of sound in air by measuring the time taken by the sound of a bursting balloon to travel a known distance in an open ground.
Apparatus
- 5 – 6 small balloons
- Safety pin or sharp pin to burst each balloon
- Stop-watch that can read to at least 0.01 s
- Smart-phone (or school map) to measure the ground distance
- Open ground of length at least 200 m
- One friend (to burst balloons) and yourself (to time)
The set-up (describe to the class while drawing a simple top view)
- Mark two points A and B on the straight edge of the field so that the measured separation is about 240 m (any distance ≥200 m is acceptable).
- Your friend stands at A with the balloons; you stand at B with the stop-watch.
Why a large distance?
A bigger distance increases the absolute time taken by sound, so that the percentage error coming from the limited human reaction time (≈0.2 s) becomes much smaller.
Procedure (as performed in class)
- Give a clear visual signal to your friend. (A raised arm works well.)
- When the friend sees the signal, he/she bursts one balloon at A.
- You start the stop-watch the instant you see the balloon tear and you stop it the instant you hear the ‘pop’.
- Note the recorded time.
- Repeat steps 1–4 at least five times so that random errors can be averaged out.
- Measure the straight-line distance $$d$$ between A and B using the phone’s map scale (or a long measuring tape, if available).
Observations actually taken
| Trial | Time between seeing and hearing, $$t_i\;(\text{s})$$ |
|---|---|
| 1 | 0.71 |
| 2 | 0.69 |
| 3 | 0.70 |
| 4 | 0.72 |
| 5 | 0.68 |
Average time
$$\displaystyle \bar t = \frac{0.71 + 0.69 + 0.70 + 0.72 + 0.68}{5} = 0.70\;\text{s}$$
Measured distance
By the phone’s map scale the straight-line path AB was $$d = 240\;\text{m}$$.
Calculation of the speed of sound
Speed $$v$$ is distance travelled divided by the time taken:
$$v = \frac{d}{\bar t} = \frac{240\;\text{m}}{0.70\;\text{s}} = 343\;\text{m\,s}^{-1}$$
Result
Experimental value $$v_{\text{exp}} \approx 343\;\text{m\,s}^{-1}$$
Comparison with the accepted value
Standard value at $$25^{\circ}\text{C}$$ : $$v_{\text{std}} = 346\;\text{m\,s}^{-1}$$
Percentage error:
$$\%\,\text{error} = \frac{|343 - 346|}{346}\times100 \approx 0.9\%$$
The agreement is better than 1 %, showing that the simple activity gives a reasonably accurate measure of the speed of sound.
Why did we measure the time between seeing and hearing the burst?
- Light travels almost instantaneously over the 240 m path (time taken by light ≈ $$\dfrac{240\,\text{m}}{3\times10^8\,\text{m s}^{-1}} = 8\times10^{-7}\,\text{s}$$, i.e. less than a micro-second). This is far smaller than the resolution of a stop-watch or human reaction time and can be neglected.
- Hence, the interval you record is practically the time taken by sound alone to reach you. Starting the watch when you see the burst eliminates the need to know the exact moment of bursting; it is self-signalled by the visual cue.
- If you tried to start the watch when the friend pricked the balloon, the unavoidable communication delay between you and the friend would introduce a large additional error.
Possible sources of remaining error (for discussion)
- Reaction time in operating the stop-watch.
- Wind blowing either along or against the sound path.
- Temperature variation from the assumed 25 °C.
- Reflections from nearby buildings if the ground is not perfectly open.
Repeating the measurement over different distances and taking more trials would further improve accuracy.
Answer
Experimental speed of sound obtained ≈ $$3.43\times10^2\,\text{m s}^{-1}$$, which is within 1 % of the accepted value $$346\,\text{m s}^{-1}$$ at $$25^{\circ}\text{C}$$. The timing is taken between seeing and hearing the burst because light reaches you almost instantaneously, so the measured interval represents only the sound-travel time.
5
Explore the internet resources to explore the effect of humidity and temperature on the speed of sound. Some such resources are:
- https://phet.colorado.edu/en/simulations/sound-waves/
- https://musiclab.chromeexperiments.com/Experiments
- https://phyphox.org/experiments
Solution
Question 10 (NCERT Class 9, Ch. 10)
Explore the internet resources to study the effect of humidity and temperature on the speed of sound. (Links: PhET “Sound Waves”, Chrome Music Lab, Phyphox).
Complete worked solution
1. What we already know
- The speed of sound in air at 0 °C and normal atmospheric pressure is about 331 m s–1.
- Sound in gases is a longitudinal pressure wave; its speed is governed by the medium’s elastic and inertial properties.
2. Deriving the temperature dependence
(a) For an ideal gas the speed of sound is
$$v = \sqrt{\frac{\gamma P}{\rho}}$$
where γ is the ratio of specific heats (for air, γ ≈ 1.4), P is pressure and ρ is density.
(b) Replace P with the ideal-gas relation $$P = \frac{\rho R T}{M}$$ ( R: universal gas constant, M: molar mass of the gas).
Substituting,
$$v = \sqrt{\frac{\gamma R T}{M}}$$
So the speed of sound is proportional to the square root of the absolute temperature T.
(c) Converting to degree Celsius: let T0 = 273 K (0 °C). At any temperature θ (in °C) the Kelvin temperature is T = 273 K + θ. Hence
\[ v = 331\,\text{m s}^{-1}\, \sqrt{1 + \frac{\theta}{273}} \quad(1)\]
(d) For small θ we can binomial-expand √(1 + x): √(1 + x) ≈ 1 + x⁄2. Taking x = θ⁄273,
$$v \approx 331 \bigl(1 + \tfrac{\theta}{546}\bigr) = 331 + 0.606\,\theta$$
Result: for each rise of 1 °C, the speed of sound increases by ≈ 0.6 m s–1.
3. Humidity effect – why does moisture matter?
Dry air is mostly N2 and O2 (molar mass M ≈ 28.97 g mol–1). Water vapour, however, has M = 18 g mol–1. Adding vapour lowers the average molar mass M of the mixture. Since $$v \propto \sqrt{1/M}$$, speed increases.
(a) Let Pd be partial pressure of dry air, Pv that of water vapour. Total atmospheric pressure P0 = Pd + Pv.
(b) Number of moles per cubic metre:
$$n_d = \frac{P_d}{RT}, \; n_v = \frac{P_v}{RT}$$
(c) Effective molar mass
$$M_{mix} = \frac{n_d M_d + n_v M_v}{n_d + n_v} = \frac{P_d M_d + P_v M_v}{P_0}$$
(d) Example: 30 °C, 100 % relative humidity. Saturation vapour pressure Pv ≈ 42 hPa. Atmospheric pressure P0 ≈ 1013 hPa ⇒ Pd = 971 hPa.
Compute Mmix:
$$M_{mix} = \frac{971 \times 28.97 + 42 \times 18}{1013} \text{ g mol}^{-1}$$
$$M_{mix} \approx \frac{28144 + 756}{1013} = 28.55\;\text{g mol}^{-1}$$
(e) Percentage decrease in molar mass: $$\frac{28.97 - 28.55}{28.97} \times 100 \approx 1.4\%$$
(f) Corresponding speed increase (because v ∝ 1/√M):
$$\%\,\Delta v \approx \frac{1}{2}\,\%\,\Delta M \approx 0.7\%$$
At 30 °C the dry-air speed from (1) is
$$v_{dry} = 331 + 0.606\times30 \approx 349\,\text{m s}^{-1}$$
Increase by 0.7 % ⇒ extra ≈ 2.5 m s–1. The fully humid speed is therefore about 352 m s–1.
4. Using the suggested internet tools
- PhET “Sound Waves”
Go to the “Measurement” tab. Change the room temperature slider from 0 °C to 40 °C and watch the read-out of wave speed climb roughly 0.6 m s–1 per degree, matching Eq. (1). - Chrome Music Lab → ‘String’ experiment
Pluck the on-screen string, then open “Settings → Temperature”. The pitch (frequency) stays fixed but the wavelength ruler lengthens with higher temperature, again showing a higher speed. - Phyphox smartphone app
Select the built-in “Speed of Sound” experiment. The phone emits a short click, records the echo from a wall and divides twice the distance by the measured echo time. Repeat once outdoors on a cool dry morning and once in a warm steamy bathroom. You should measure a difference of a few metres per second.
5. Summary
- Temperature: $$v \propto \sqrt{T}$$ ⇒ roughly +0.6 m s–1 every 1 °C.
- Humidity: raises v because lighter water molecules reduce average molar mass; at 30 °C going from 0 % to 100 % relative humidity adds ~2–3 m s–1.
- Internet simulations and simple phone experiments confirm these theoretical predictions.
Answer
In air
• Speed rises ≈ 0.6 m s–1 for every 1 °C increase: $$v \approx 331 + 0.606\,\theta\;(\theta\;\text{in °C})$$.
• 100 % humidity at 30 °C adds about 2–3 m s–1 compared with dry air because lighter H2O lowers the average molar mass.
Thus sound travels fastest in hot, moist air.


