Join WhatsApp Icon JEE WhatsApp Group
NCERT Solutions for Class 9 Maths

Chapter 7: The Mathematics of Maybe: Introduction to Probability

Download Solutions PDF
Daily JEE Updates, Tips & Important Alerts
Join 30,000+ students and stay updated with JEE notifications and preparation insights.
Join Now!
Free PDF
Complete NCERT Solution PDF for Chapter 7: The Mathematics of Maybe: Introduction to Probability
Download Solutions PDF

Examples

Example 1

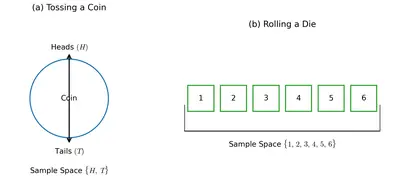
Experiment: A coin is tossed
Possible Outcomes: Heads (H) or Tails (T) (See Fig. 7.2)
Sample Space: $$\{H, T\}$$

Experiment: A die is rolled
Possible Outcomes: The top side of the die shows 1, 2, 3, 4, 5, or 6 dots (See Fig. 7.3)
Sample Space: $$\{1, 2, 3, 4, 5, 6\}$$

Fig. 7.2
Fig. 7.2

Solution

Exercise 7.4 Question 2
If $$ABC$$ is a triangle, locate a point in its interior which is equidistant from all the vertices of $$\triangle ABC$$.

Required point : The point that is equidistant from the three vertices is called the circum-centre of the triangle.

Construction steps

  1. Draw the given $$\triangle ABC$$ on a sheet of paper.
  2. With a compass, take $$AB$$ as the base. Mark its mid-point $$M$$ (measure $$AB$$, set the compass at its half-length, and cut an arc from both $$A$$ and $$B$$ so that the arcs intersect; join the intersection points to obtain the perpendicular bisector).
    Draw the line through $$M$$ perpendicular to $$AB$$.
    This line is the perpendicular bisector of $$AB$$.
  3. Repeat the above procedure for another side, say $$BC$$, to get its perpendicular bisector l2.
  4. The two perpendicular bisectors l1 and l2 intersect at a point; call this point $$O$$.
  5. (Optional) Draw the perpendicular bisector of the third side $$CA$$ to verify that it also passes through the same point $$O$$. This confirms the concurrency of the three perpendicular bisectors.

Reasoning / Proof

  • Every point on the perpendicular bisector of a segment is equidistant from the segment’s end-points. Hence $$OM = ON\;\Rightarrow\; OA = OB$$ for the bisector of $$AB$$ and $$OB = OC$$ for the bisector of $$BC$$.
  • Combining the two relations gives
    $$OA = OB = OC$$.
  • Thus the intersection point $$O$$ is simultaneously equidistant from $$A,\,B$$ and $$C$$.

Therefore, the required point inside $$\triangle ABC$$ that is equidistant from all its vertices is the circum-centre $$O$$, obtained as the common point of the perpendicular bisectors of the three sides. A circle drawn with centre $$O$$ and radius $$OA$$ will pass through all the three vertices (circumcircle).

Answer

The required point is the circum-centre O, i.e. the common point of the three perpendicular bisectors of the sides of $$\triangle ABC$$. It is equidistant from $$A,\,B$$ and $$C$$.

Example 2 Suppose you roll a die 50 times, and it lands on a 4 exactly 8 times.

Solution

Step 1 : Identify the event
Let the event $$E$$ be “the die shows a 4”.

Step 2 : Write down the experimental probability formula
For any event, the experimental (or empirical) probability is defined as
$$P(E)=\frac{\text{Number of times the event occurs}}{\text{Total number of trials}}$$

Step 3 : Substitute the given numbers
Here the die is rolled 50 times, so the total number of trials is $$50$$.
The die shows a 4 exactly 8 times, so the number of times the event occurs is $$8$$.
Hence
$$P(E)=\frac{8}{50}$$

Step 4 : Simplify the fraction
Divide numerator and denominator by their highest common factor (which is $$2$$):
$$\frac{8\div 2}{50\div 2}=\frac{4}{25}$$
Therefore
\[P(E)=\frac{4}{25}=0.16\]

Conclusion
The experimental probability that the die shows a 4 is $$\frac{4}{25}\,(0.16)$$.

Answer

$$P(\text{getting a 4}) = \dfrac{4}{25} = 0.16$$

Example 3 If you roll a standard 6-sided die, what is the theoretical probability of getting a 4?

Solution

Step 1 — Describe the experiment
Rolling a standard die is a random experiment with six equally likely outcomes.

Step 2 — Write the sample space
The set of all possible results is the sample space:
$$S=\{1,2,3,4,5,6\}$$
Hence, the total number of equally likely outcomes is
$$n(S)=6$$.

Step 3 — Define the favourable event
Let the event E be “getting a 4.”
There is only one outcome in E:
$$E=\{4\}$$
So, the number of favourable outcomes is
$$n(E)=1$$.

Step 4 — Apply the probability formula
The theoretical probability of an event is
\[P(E)=\frac{n(E)}{n(S)}\]
Substituting the values,
$$P(\text{getting }4)=\frac{1}{6}$$.

Conclusion
The probability of getting a 4 when a fair six-sided die is rolled is
\[\boxed{\dfrac{1}{6}}\]

Answer

$$\dfrac{1}{6}$$

Example 4 A letter is picked at random from the word 'PROBABILITY'. What is the probability of picking the letter B?

Solution

Step 1 – Form the sample space
The word ‘PROBABILITY’ consists of 11 letters:
P, R, O, B, A, B, I, L, I, T, Y.

Therefore, the total number of equally likely outcomes is
$$n(S)=11$$

Step 2 – Describe the event
Let $$E$$ be the event “the letter picked is B”.
There are two B’s in the word, so
$$n(E)=2$$

Step 3 – Apply the probability formula
The classical probability of an event is
$$P(E)=\frac{n(E)}{n(S)}$$

Substituting the numbers,
$$P(E)=\frac{2}{11}$$

Thus the probability of picking the letter B is

\[ \boxed{\dfrac{2}{11}} \]

Answer

$$\dfrac{2}{11}$$

Example 5 Suppose you anonymously collect information regarding the favourite fruit of 50 students in your class. Let us assume that the results are: 20 students like mango, 15 students like apples, 10 students like bananas, and 5 students like grapes.
Let us play a game! Suppose we randomly pick one student from the class and try to guess their favourite fruit. What's the probability that the student's favourite fruit is mango?

Solution

First, recall the definition of (classical) probability for a random experiment with equally likely outcomes:

$$\text{Probability of an event} = \dfrac{\text{Number of favourable outcomes}}{\text{Total number of possible outcomes}}.$$

Here, the ‘experiment’ is “picking one student at random from the class”, and the ‘event’ whose probability we want is “the chosen student’s favourite fruit is mango”.

Step 1: Find the total number of possible outcomes.
There are $$50$$ students in the class, so the total number of possible outcomes is $$50$$.

Step 2: Find the number of favourable outcomes.
According to the collected data, $$20$$ students like mango. Therefore, the number of favourable outcomes is $$20$$.

Step 3: Substitute in the probability formula.

$$\text{Probability(student likes mango)} = \dfrac{20}{50}.$$

Step 4: Simplify the fraction.

Divide numerator and denominator by their highest common factor, $$10$$:

$$\dfrac{20}{50} = \dfrac{20 \div 10}{50 \div 10} = \dfrac{2}{5}.$$

We can also express this as a decimal:

$$\dfrac{2}{5} = 0.4.$$

Hence, the probability that a randomly chosen student’s favourite fruit is mango is $$\dfrac{2}{5}$$, or $$0.4$$ (i.e. 40 %).

Answer

$$\dfrac{2}{5} \; (= 0.4)$$

Example 6

Let us say you are playing Snakes and Ladders, and you are rolling a fair 6-sided die to move.

You have just rolled the die three times in a row, and each time you got a 6.

Now, you think: 'I have already rolled three 6s — there is no way I will get a 6 again on the next roll!'

Solution

Step 1 – Recall the fundamental fact about a fair die
For a single roll of a fair 6-sided die, the set of all equally-likely outcomes (the sample space) is
$$S = \{1,2,3,4,5,6\}.$$
Hence the probability of getting any one specified face, say a 6, is

\[P(6)=\dfrac{\text{number of favourable outcomes}}{\text{total number of outcomes}}=\dfrac{1}{6}.\]

Step 2 – Understand independence of successive rolls
Every roll of the die is a fresh physical event. The die has no “memory’’ of what occurred earlier, so the outcome of a new roll is independent of all previous outcomes. In symbols, if $A$ is the event “a 6 appears on the next roll’’ and $B$ is the event “the first three rolls were all sixes,’’ then

$$P(A\mid B)=P(A).$$

Step 3 – Compute the required probability
We have already found $P(A)=\dfrac16$. Because of independence, this value does not change even after the earlier three 6s:

\[P(\text{getting a 6 on the fourth roll})=\dfrac16.\]

Step 4 – Conclude
Your intuition that “there is no way another 6 will come’’ is an example of the Gambler’s Fallacy. The correct mathematical answer is that the probability of rolling a 6 on the very next throw is still exactly $$\dfrac16$$.

Answer

$$\dfrac16$$

Example 7

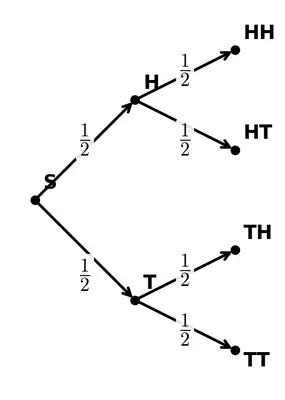
Experiment: Toss a fair coin two times.
Tree Diagram (See Fig. 7.6).
Fig. 7.6
Fig. 7.6

Solution

Objective : Represent the experiment “toss a fair coin two times” by means of a tree diagram and list the complete sample space. Because the coin is fair, the probability of Head (H) or Tail (T) on each individual toss is

$$P(H)=\tfrac12, \qquad P(T)=\tfrac12.$$

Step 1 – First toss
Start with a single point (called the root). From it draw two branches:

  • left branch labelled “H” for Head,
  • right branch labelled “T” for Tail.

At the end of every branch write the probability $$\tfrac12$$.

Step 2 – Second toss
From each of the two points obtained after the first toss, draw two more branches, again one marked “H” and the other “T”, each carrying probability $$\tfrac12$$. Altogether you now have four end-points (also called leaf nodes).

Step 3 – Reading the outcomes
Read an outcome by tracing a path from the root to a leaf and writing the labels in the same order.

Path through the treeOutcome written as an ordered pairProbability of the path
H followed by HHH$$\tfrac12\times\tfrac12 = \tfrac14$$
H followed by THT$$\tfrac12\times\tfrac12 = \tfrac14$$
T followed by HTH$$\tfrac12\times\tfrac12 = \tfrac14$$
T followed by TTT$$\tfrac12\times\tfrac12 = \tfrac14$$

Step 4 – The sample space
Collecting the four possible ordered pairs gives the sample space

\[S = \{HH,\; HT,\; TH,\; TT\}.\]

Every path in the tree diagram ends in one of these four equally likely outcomes, each having probability $$\tfrac14$$, and the probabilities add up to 1, as required:

$$\tfrac14+\tfrac14+\tfrac14+\tfrac14 = 1.$$

Description of the diagram to draw
1. Draw one starting point.
2. From it draw two branches labelled “H” and “T”, writing $$\tfrac12$$ midway on each branch.
3. From the tip of the “H” branch draw two more branches, again labelled “H” and “T”, each bearing $$\tfrac12$$.
4. Repeat the previous step for the tip of the first “T” branch.
5. At each of the four leaf nodes write the complete outcome (HH, HT, TH or TT) and its probability $$\tfrac14$$.

The tree diagram thus constructed visually confirms both the sample space and the probability of each outcome.

Answer

Sample space : $$\{HH,\;HT,\;TH,\;TT\}$$   (each outcome has probability $$\tfrac14$$). See the described tree diagram.

Exercise Set 7.1

1 Rank the following events on a scale from 0 (Impossible) to 1 (Certain). Label each event: Impossible, less likely, equally likely (even chance), more likely, certain. Give reasons why you gave each event its ranking.

(i) The next Monday will come after Sunday.

Solution

Every calendar week has the fixed order Sunday → Monday → Tuesday → … .
Therefore, immediately after any Sunday the very next day is Monday. There is no uncertainty involved.

Probability ranking  $$=1$$ (Certain).

Answer

Certain  (probability 1)

(ii) It will snow in Mumbai in July.

Solution

Mumbai lies in the tropical coastal region of India, where the temperature in July (the monsoon season) is far above the freezing point. Recorded climate data show that it has never snowed in Mumbai at any time of the year.

Hence the probability of snowfall in Mumbai in July is practically zero.

Probability ranking  $$=0$$ (Impossible).

Answer

Impossible  (probability 0)

(iii) An elephant will walk through your classroom today.

Solution

Classrooms are usually located inside school buildings, and elephants are not kept on school premises. Although not a logical impossibility, the chances that an elephant will just walk through an ordinary classroom on a given day are extremely remote.

A reasonable numerical estimate would be something like $$0.01$$ or even smaller, i.e. much closer to 0 than to 1.

Probability ranking  $$\approx 0.01$$ (Less likely).

Answer

Less likely  (probability close to 0, e.g. 0.01)

(iv) You will greet at least one friend at school tomorrow.

Solution

If you normally attend school and have friends there, you typically meet and greet at least one of them. While it is possible that, say, you stay silent or all friends are absent, that situation is uncommon.

A reasonable probability estimate is well above $$\tfrac12$$, say about $$0.8$$.

Probability ranking  $$\approx 0.8$$ (More likely).

Answer

More likely  (probability about 0.8)

Exercise Set 7.2

1 A teacher mixes a large bag of sweets of different colours and randomly selects a sample of 30 sweets. She counts the number of sweets of each colour:
10 red sweets | 8 green sweets | 7 yellow sweets | 5 blue sweets

(i) Calculate the probability that a randomly picked sweet from the sample is green.

Solution

Total number of sweets in the sample = $$30$$.
Number of green sweets = $$8$$.

Probability that a randomly chosen sweet is green is obtained by the classical definition:

$$\text{Probability} = \frac{\text{Number of favourable outcomes}}{\text{Total number of possible outcomes}} = \frac{8}{30}$$

Simplify the fraction (divide numerator and denominator by $$2$$):

$$\frac{8}{30}=\frac{8\div2}{30\div2}=\frac{4}{15}$$

Hence the required probability is

\[\frac{4}{15}\]

Answer

$$\dfrac{4}{15}$$

(ii) If there are 600 sweets in total in the large bag, estimate how many are likely to be yellow, based on the sample results.

Solution

Proportion of yellow sweets in the sample:

$$\text{Yellow proportion}=\frac{7}{30}$$

Assuming the sample accurately represents the whole bag, apply this proportion to the total of $$600$$ sweets:

$$\text{Estimated yellow sweets}=\frac{7}{30}\times600$$

Simplify before multiplying:

$$\frac{600}{30}=20\;\Longrightarrow\;7\times20=140$$

Therefore, the large bag is likely to contain about

\[140\text{ yellow sweets}\]

Answer

Approximately $$140$$ yellow sweets

2 A survey is conducted at a school where a random sample of 40 students is asked about their favourite club. The responses are:
14 students: Science Club | 11 students: Arts Club |
9 students: Sports Club | 6 students: Debate Club
Assume there are 800 students in the whole school.

(i) What is the probability that a randomly chosen student from the sample prefers the Arts Club?

Solution

The probability of an event is defined as

$$P(\text{event}) = \dfrac{\text{number of favourable outcomes}}{\text{total number of outcomes}}.$$

Here, the event is “a student in the sample prefers the Arts Club.”

  • Number of favourable outcomes = 11 (students who chose Arts Club)
  • Total number of outcomes = 40 (students in the sample)

Therefore,

\[ P(\text{Arts Club}) = \dfrac{11}{40}. \]

In decimal form,

$$P(\text{Arts Club}) = \frac{11}{40} = 0.275.$$

Answer

$$P(\text{Arts Club}) = \dfrac{11}{40} = 0.275.$$

(ii) Using the sample results, estimate how many students in the whole school are likely to prefer the Sports Club.

Solution

The sample tells us that 9 out of 40 students prefer the Sports Club. We assume the sample is representative of the whole school.

First find the proportion of Sports-Club fans in the sample:

$$\text{Proportion} = \dfrac{9}{40}.$$

Now apply this proportion to the total school strength (800 students):

\[ \text{Estimated number} = \dfrac{9}{40} \times 800. \]

Compute step by step:

$$\dfrac{9}{40} \times 800 = 9 \times \dfrac{800}{40} = 9 \times 20 = 180.$$

Hence, about 180 students in the whole school are likely to prefer the Sports Club.

Answer

Approximately 180 students are expected to prefer the Sports Club.

3 Toss a coin 20 times and record the result each time (heads or tails).

(i) How many times did you get heads?

Solution

During the experiment the results of the 20 consecutive tosses were noted down in the following order:

H, T, H, H, T, H, T, T, H, H, T, H, T, T, H, H, T, H, T, H

We now count only the H’s (heads).

Listing the positions where a head occurred:
1, 3, 4, 6, 9, 10, 12, 15, 16, 18, 20

That is a total of 11 heads.

Therefore $$\text{Number of heads}=11$$.

Answer

11

(ii) How many times did you get tails?

Solution

The coin was tossed 20 times in all. We have already counted 11 heads.

Hence the remaining outcomes must be tails:

$$\text{Number of tails}=20-11=9$$

A direct count of the T’s in the recorded list also gives 9.

Answer

9

(iii) Calculate the experimental probability of getting heads.

Solution

The experimental (empirical) probability of an event is defined as

$$P(\text{event})=\frac{\text{number of times the event occurs}}{\text{total number of trials}}.$$

Here the event is “getting a head”.
Number of heads = 11,  total trials = 20.

Hence
$$P(\text{head})=\frac{11}{20}=0.55.$$

Answer

$$\displaystyle\frac{11}{20}=0.55$$

(iv) If you toss the coin once more, what is the probability of getting tails?

Solution

A fresh toss of the same fair coin is independent of the previous 20 tosses. For a fair coin, the theoretical probability of each face is

$$P(\text{tail})=\frac{1}{2}=0.5.$$

Answer

$$\displaystyle\frac{1}{2}=0.5$$

4

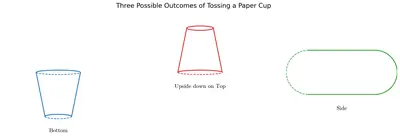
Toss a paper cup into the air 100 times. After each toss record whether the cup lands on its bottom, upside down on its top or on its side (See Fig. 7.5). Assign probabilities to the outcomes by using experimental probability.
Fig. 7.5
Fig. 7.5

Solution

Step 1 : Collect the data

After each of the 100 throws, note the face on which the cup finally rests. Let

  • $$b$$ = number of times the cup lands on its bottom
  • $$t$$ = number of times the cup lands up-side-down on its top
  • $$s$$ = number of times the cup lands on its side

Because every throw ends in exactly one of the three positions, we must have

$$b + t + s = 100.$$

Step 2 : Use the definition of experimental probability

For any outcome,

$$\text{Experimental probability} = \dfrac{\text{Number of times the outcome occurs}}{\text{Total number of trials}}.$$ Hence

  • Probability of landing on the bottom:
    \[P(\text{bottom}) = \dfrac{b}{100}\]
  • Probability of landing upside-down on the top:
    \[P(\text{top}) = \dfrac{t}{100}\]
  • Probability of landing on the side:
    \[P(\text{side}) = \dfrac{s}{100}\]

Step 3 : Check that the probabilities add to 1

\[P(\text{bottom}) + P(\text{top}) + P(\text{side}) = \dfrac{b}{100} + \dfrac{t}{100} + \dfrac{s}{100} = \dfrac{b+t+s}{100} = 1,\] as required.

Illustration (example counts)

If, for instance, the actual tally after 100 throws were

OutcomeObserved frequency
Bottom42
Top31
Side27

then the assigned (experimental) probabilities would be

  • $$P(\text{bottom}) = \dfrac{42}{100} = 0.42$$
  • $$P(\text{top}) = \dfrac{31}{100} = 0.31$$
  • $$P(\text{side}) = \dfrac{27}{100} = 0.27$$

The procedure is identical for whatever actual numbers you record; just substitute your own values of $$b$$, $$t$$ and $$s$$ in the formulas above.

Answer

If the cup lands $$b$$ times on its bottom, $$t$$ times upside-down on its top and $$s$$ times on its side in 100 throws, then

$$P(\text{bottom}) = \dfrac{b}{100},\; P(\text{top}) = \dfrac{t}{100},\; P(\text{side}) = \dfrac{s}{100}.$$

5 What is the probability of getting an even number when rolling a fair 6-sided die?

Solution

Step 1: List the sample space.
When a fair six-sided die is rolled, the possible outcomes are
$$S=\{1,2,3,4,5,6\}$$
Thus $$n(S)=6$$.

Step 2: Identify the favourable outcomes.
An even number results when the upper face shows $$2,4,6$$, so
$$E=\{2,4,6\}$$
and therefore $$n(E)=3$$.

Step 3: Use the definition of probability.
For equally likely outcomes, the probability of the event $$E$$ is

\[P(E)=\frac{n(E)}{n(S)}=\frac{3}{6}=\frac{1}{2}\]

Hence, the probability of getting an even number is $$\dfrac{1}{2}$$.

Answer

$$\dfrac{1}{2}$$

6 Suppose you roll a 6-sided die 12 times and get a '3' three times.

(i) What is the experimental probability of rolling a '3'?

Solution

In an experiment we estimate probability by comparing
how many times the required outcome actually appears with the total
number of trials performed.

Total number of throws = 12

Number of times a ‘3’ is obtained = 3

Therefore the experimental probability is

$$P(\text{getting }3)=\frac{\text{number of favourable throws}}{\text{total throws}}$$
$$P(\text{getting }3)=\frac{3}{12}=\frac{1}{4}=0.25$$

Answer

$$\displaystyle P(\text{getting }3)=\frac{1}{4}=0.25$$

(ii) What is the theoretical probability of rolling a '3'?

Solution

The theoretical (or classical) probability is calculated from the assumption that the die is fair and each face is equally likely.

Total possible outcomes when a die is rolled once = 6
Favourable outcome for a ‘3’ = 1

Hence

$$P(\text{getting }3)=\frac{1}{6}\approx0.166\,7$$

Answer

$$\displaystyle P(\text{getting }3)=\frac{1}{6}\;(\approx0.167)$$

(iii) Why might these probabilities be different? What would you expect to happen if you roll the die 60, 600, or 6000 times?

Solution

The two probabilities differ because in only 12 trials the random variation (chance errors) is still large. The experimental probability of $$0.25$$ is therefore slightly higher than the theoretical value $$\frac16$$.

According to the Law of Large Numbers, as the number of trials increases, the experimental probability tends to move closer to the theoretical probability.

  • 60 throws: expected number of ‘3’s $$=60\times\frac16=10$$, so the experimental probability should be near $$\frac{10}{60}=\frac16\;(\approx0.167).$$
  • 600 throws: expected ‘3’s $$=600\times\frac16=100$$, giving a probability close to $$\frac{100}{600}=\frac16.$$ Random fluctuations will now be only a few percent.
  • 6000 throws: expected ‘3’s $$=6000\times\frac16=1000$$, so the experimental probability will be even nearer to $$\frac16$$; the discrepancy becomes very small.

Thus, with more and more trials the experimental and theoretical probabilities should almost coincide.

Answer

They differ because 12 trials are too few; chance variation is large. For about 60, 600, or 6000 throws the experimental probability should get progressively closer to the theoretical value $$\frac16$$ (≈ 0.167).

Exercise Set 7.3

1 When a single 6-sided die is rolled, what is the total number of possible outcomes in the sample space?

Solution

When a single, fair, 6-sided die is rolled, exactly one of its six faces comes up.

The numbers on the faces are $$1,2,3,4,5,6$$, so the sample space $$S$$ is

$$S = \{1,2,3,4,5,6\}$$

The total number of possible outcomes equals the number of elements in this set, that is its cardinality:

$$|S| = 6$$

Hence, the sample space contains six outcomes.

Answer

$$6$$

2 For the following experiments write down the sample space S.

(i) Rolling a die and tossing a coin together.

Solution

Experiment (i): Roll a die and toss a coin simultaneously.

1. Outcomes for rolling a die: $$1,2,3,4,5,6$$  (six equally likely numbers).

2. Outcomes for tossing a coin: $$H$$ (Head), $$T$$ (Tail)  (two equally likely results).

3. For a combined experiment we list ordered pairs – first the die result, then the coin result.

Hence the sample space is

$$S=\{(1,H),(1,T),(2,H),(2,T),(3,H),(3,T),(4,H),(4,T),(5,H),(5,T),(6,H),(6,T)\}.$$

There are $$6\times2=12$$ equally likely sample points.

Answer

$$S=\{(1,H),(1,T),(2,H),(2,T),(3,H),(3,T),(4,H),(4,T),(5,H),(5,T),(6,H),(6,T)\}$$

(ii) Choosing a random integer between $$-5$$ and $$+5$$.

Solution

Experiment (ii): Choose a random integer between $$-5$$ and $$+5$$ (inclusive).

The integers from $$-5$$ to $$+5$$ are obtained by listing every whole number in that interval:

$$-5,-4,-3,-2,-1,0,1,2,3,4,5.$$

Thus the sample space is

$$S=\{-5,-4,-3,-2,-1,0,1,2,3,4,5\}.$$

The total number of sample points is $$11$$.

Answer

$$S=\{-5,-4,-3,-2,-1,0,1,2,3,4,5\}$$

(iii) A box containing 5 green and 7 red balls. One ball is drawn at random.

Solution

Experiment (iii): A box contains 5 green and 7 red balls. One ball is drawn at random.

Because we are interested only in the colour of the drawn ball (not which particular green or red ball), there are exactly two distinct possible outcomes:

  • $$G$$  : a green ball is drawn,
  • $$R$$  : a red ball is drawn.

Therefore the sample space is

$$S=\{G,R\}.$$

Answer

$$S=\{G,R\}$$

3 In a village fair, there are 3 popular snacks available: Samosa, Pakora, and Bhaji. For drinks, villagers can choose either Chai or Lassi.

(i) List the sample space of all possible snack and drink combinations a person could choose at the fair.

Solution

The sample space (denoted by $$S$$) is the set of every possible ordered pair “(snack, drink)” that can be formed from

  • 3 choices of snack: Samosa (Sa), Pakora (Pa), Bhaji (B)
  • 2 choices of drink: Chai (C), Lassi (L)

Counting the possible pairs:

$$n(S) = 3 \times 2 = 6$$ distinct outcomes.

Thus

\[S = \{(\text{Sa},\,\text{C}),\,(\text{Sa},\,\text{L}),\,(\text{Pa},\,\text{C}),\,(\text{Pa},\,\text{L}),\,(\text{B},\,\text{C}),\,(\text{B},\,\text{L})\}\]

Answer

$$S = \{(\text{Sa},\,\text{C}),\,(\text{Sa},\,\text{L}),\,(\text{Pa},\,\text{C}),\,(\text{Pa},\,\text{L}),\,(\text{B},\,\text{C}),\,(\text{B},\,\text{L})\}$$

(ii) List the event 'Selecting Samosa as a snack.'

Solution

The required event $$E$$ is “the snack chosen is Samosa”. Once Samosa is fixed, the drink can still be either Chai or Lassi, giving two favourable outcomes.

\[E = \{(\text{Sa},\,\text{C}),\,(\text{Sa},\,\text{L})\}\]

Answer

$$E = \{(\text{Sa},\,\text{C}),\,(\text{Sa},\,\text{L})\}$$

Exercise Set 7.4

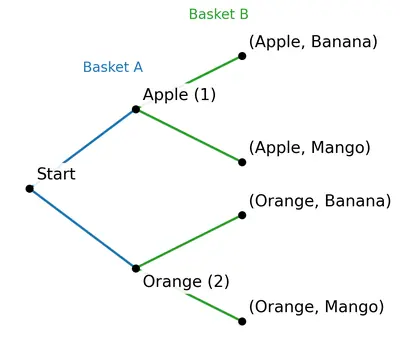
1 There are two fruit baskets A and B. Basket A has one apple and two oranges. Basket B has one banana and one mango. You randomly pick one fruit from each basket.

(i)

Draw a tree diagram showing all possible pairs of fruits.
Figure
Figure

Solution

Let the experiment proceed in two successive stages.

  • Stage 1 – pick from Basket A
    Basket A contains 3 individual pieces of fruit:
    • 1 Apple → label it $$A$$
    • 2 Oranges → label them $$O_1$$ and $$O_2$$ (we keep them distinct so that every basic outcome of the experiment is equally likely).
  • Stage 2 – pick from Basket B
    Basket B contains exactly two fruits:
    • 1 Banana, $$B$$
    • 1 Mango, $$M$$.

To draw the tree diagram, proceed as follows:

  1. Draw a starting node (dot).
  2. From this node draw three branches for the three possible fruits from Basket A, and label them $$A$$, $$O_1$$ and $$O_2$$.
  3. From the end of each of these branches draw two further branches for the two possibilities from Basket B. Label these second-stage branches $$B$$ and $$M$$.
  4. Write the ordered pair at the tip of every second-stage branch, in the order (fruit from A, fruit from B). For example, the branch that starts with $$A$$ and then goes to $$B$$ is labelled $$(A,B)$$, and so on.

The finished tree therefore shows six leaf nodes corresponding to the six ordered pairs:

$$(A,B),\; (A,M),\; (O_1,B),\; (O_1,M),\; (O_2,B),\; (O_2,M).$$

Answer

Tree diagram must have 3 first-level branches ($$A, O_1, O_2$$) and, from each of them, 2 second-level branches ($$B, M$$), giving six leaves labelled $$ (A,B), (A,M), (O_1,B), (O_1,M), (O_2,B), (O_2,M).$$

(ii) List the sample space.

Solution

The sample space $$S$$ is the set of all possible ordered pairs obtained when one fruit is drawn from each basket. From the tree in part (i) we read off all six equally likely outcomes:

\[ S = \{ (A,B),\; (A,M),\; (O_1,B),\; (O_1,M),\; (O_2,B),\; (O_2,M) \}. \]

Answer

$$S=\{(A,B),(A,M),(O_1,B),(O_1,M),(O_2,B),(O_2,M)\}$$

(iii) What is the probability of picking one apple and one banana?

Solution

We want the probability of the event

$$E = \{\text{“one apple and one banana”}\} = \{(A,B)\}.$$

Every basic outcome in the sample space $$S$$ is equally likely (each corresponds to first choosing one of the 3 individual fruits from Basket A and then one of the 2 from Basket B, so each has probability $$\dfrac{1}{3}\times \dfrac{1}{2}=\dfrac16$$).

Number of favourable outcomes: $$n(E)=1$$.
Total number of outcomes: $$n(S)=6$$.

Hence the required probability is

\[ P(E)=\frac{n(E)}{n(S)}=\frac{1}{6}. \]

Answer

$$P(\text{one apple and one banana})=\dfrac16$$

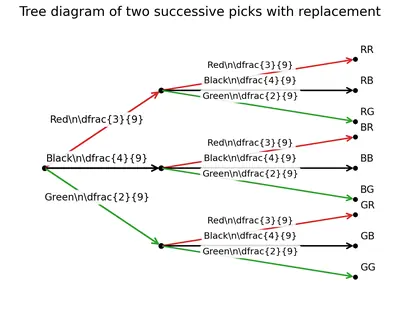
2 Let us say that you have a box containing 3 red pens, 4 black pens and 2 green pens. You pick a pen (without looking) from the box and put it back. Then your friend does the same.

(i)

What are the possible outcomes of the pen colours? Can you draw a tree diagram representing the possible outcomes?
Figure
Figure

Solution

The total number of pens in the box is

$$3 + 4 + 2 = 9.$$

When you draw first, three different colours can appear:

  • Red  (R) – with probability $$\dfrac{3}{9} = \dfrac13$$
  • Black (B) – with probability $$\dfrac{4}{9}$$
  • Green (G) – with probability $$\dfrac{2}{9}$$

The pen is then replaced, so the same probabilities apply to your friend’s draw.

All possible ordered pairs (first you, then your friend) are therefore

$$(R,R),\,(R,B),\,(R,G),\,(B,R),\,(B,B),\,(B,G),\,(G,R),\,(G,B),\,(G,G).$$

Tree diagram (verbal description)

  1. Draw one starting point.
  2. From it, draw three branches labelled R, B, G with probabilities $$\tfrac13,\,\tfrac49,\,\tfrac29.$$
    • At the end of each branch draw three second-level branches (again R, B, G) carrying the same probabilities, because the pen is replaced.
  3. At the tips you now have 9 end-points representing the nine ordered pairs listed above. Multiply the probabilities along a path to get the probability of that particular pair.

Answer

Possible outcomes: (R,R), (R,B), (R,G), (B,R), (B,B), (B,G), (G,R), (G,B), (G,G).
Yes—draw a two-stage tree with branches R, B, G at each stage, labelled by probabilities $$\tfrac13,\,\tfrac49,\,\tfrac29$$ respectively.

(ii) Can you use the tree diagram to guess the probability that both you and your friend pick pens of the same colour?

Solution

From the tree, the probability of any particular path is the product of the two stage-probabilities.

Both pens same colour means the three paths (R,R), (B,B) and (G,G).

Compute each:

  • (R,R): $$\dfrac13 \times \dfrac13 = \dfrac19$$
  • (B,B): $$\dfrac49 \times \dfrac49 = \dfrac{16}{81}$$
  • (G,G): $$\dfrac29 \times \dfrac29 = \dfrac{4}{81}$$

Add them:

$$\dfrac19 + \dfrac{16}{81} + \dfrac{4}{81} = \dfrac{9}{81} + \dfrac{16}{81} + \dfrac{4}{81} = \dfrac{29}{81}.$$

Thus, the required probability is

\[\dfrac{29}{81}\].

Answer

Probability that both draws show the same colour = $$\dfrac{29}{81}\approx0.3580.$$

End-of-Chapter Exercises

1 Fill in the blanks.

(i) The probability of an impossible event is ______.

Solution

In probability, every event is assigned a number between 0 and 1 inclusive.

  • If an event cannot occur under any circumstance, it is called an impossible event.
  • The lower end of the probability scale is 0.

Hence, the probability of an impossible event is $$0$$.

Answer

0

(ii) The set of all possible outcomes of a random experiment is called the ________.

Solution

The collection of all possible outcomes that can occur when a random experiment is performed once is known as the sample space.

Therefore, the required term is sample space.

Answer

sample space

(iii) The probability of an event that is certain to happen is ______.

Solution

An event that is certain (sure) to happen has the greatest possible probability on the 0-to-1 scale.

The upper end of this scale is $$1$$.

Therefore, the probability of a certain event is $$1$$.

Answer

1

(iv) Tossing a fair coin has a probability of _____ for getting heads.

Solution

For a fair coin there are exactly two equally likely outcomes when it is tossed once: Heads (H) and Tails (T).

Thus

$$P(\text{Heads}) = \frac{\text{number of favourable outcomes}}{\text{total possible outcomes}} = \frac{1}{2}.$$

Answer

\(\dfrac{1}{2}\)

2 In a survey of 50 students, 15 students said they liked football. The number of students who like football is 15, and the _______ (frequency/relative frequency) is ________ (fill in the fraction or decimal).

Solution

The problem gives the following information:

  • Total number of students surveyed  $$= 50$$.
  • Number of students who said they liked football  $$= 15$$.

Step 1 · Identify the statistical terms

The raw count “15” is called the frequency of the response “likes football.”
To compare this count with the total, we divide by the total number of observations; that quotient is called the relative frequency.

Step 2 · Compute the relative frequency

The relative frequency (often written as a fraction or a decimal) is

$$\text{relative frequency}=\dfrac{\text{frequency}}{\text{total number of observations}}$$

Substituting the given numbers,

$$\text{relative frequency}=\dfrac{15}{50}$$

We can leave the answer as a fraction or convert it to a decimal:

$$\dfrac{15}{50}=\dfrac{3}{10}=0.3$$

Step 3 · Fill in the blanks

“The number of students who like football is 15, and the relative frequency is $$\dfrac{15}{50}=0.3$$.”

Answer

relative frequency  =  $$\dfrac{15}{50}=0.3$$

3 Which of the following experiments have equally likely outcomes? Explain.

(i) A driver attempts to start a car. The car starts or does not start.

Solution

For two outcomes to be equally likely each must occur with the same probability.

The probability that a particular car will start depends on many factors: condition of the battery, availability of fuel, weather, etc. In most real situations the car starts much more (or much less) often than it fails.

Hence the two possible results — “starts” and “does not start” — do not occur with the same probability.

Answer

Outcomes are not equally likely.

(ii) Tossing a fair coin once.

Solution

A fair coin has no bias toward either face.

Sample space: $$S=\{\text{H},\,\text{T}\}$$

Because the coin is fair,

$$P(\text{H})=\tfrac12 \qquad\text{and}\qquad P(\text{T})=\tfrac12$$

The two probabilities are equal, so the outcomes are equally likely.

Answer

Outcomes are equally likely.

(iii) Rolling a fair 6-sided die.

Solution

For a fair 6–sided die each face is equally likely to appear.

Sample space: $$S=\{1,2,3,4,5,6\}$$

For every face $$P(1)=P(2)=\cdots=P(6)=\tfrac16$$

All six outcomes therefore have the same probability, so they are equally likely.

Answer

Outcomes are equally likely.

(iv) Choosing a marble randomly from a bag that contains 3 red marbles and 7 blue marbles.

Solution

The bag holds 3 red and 7 blue marbles (total 10).

Sample space: $$S=\{\text{Red},\,\text{Blue}\}$$

Probabilities:

$$P(\text{Red})=\tfrac3{10}=0.3 \qquad P(\text{Blue})=\tfrac7{10}=0.7$$

Since $$0.3\neq0.7,$$ the two possible results do not have equal probability.

Answer

Outcomes are not equally likely.

(v) A baby is born. It is a boy or a girl.

Solution

The biological probability of a boy and that of a girl are close but not exactly equal; statistical data show a slight predominance of boys.

Therefore the two outcomes — “boy” and “girl” — cannot be assumed to have the same probability without additional information.

Answer

Outcomes are not equally likely.

4 Write the sample space and calculate the probability based on the given information.

(i) Two coins are tossed at the same time. What is the probability of getting at least one head?

Solution

Each of the two unbiased coins has two possible outcomes, Head (H) or Tail (T).

Sample space:

$$S = \{HH,\,HT,\,TH,\,TT\}$$

Thus $$n(S)=4$$.

Event $$A$$: getting at least one head.

Favourable outcomes:

$$A = \{HH,\,HT,\,TH\}$$ so $$n(A)=3$$.

Required probability:

\[P(A)=\dfrac{n(A)}{n(S)}=\dfrac{3}{4}\]

Answer

$$\dfrac{3}{4}$$

(ii) Ten identical cards numbered 1 to 10 are placed in a box. One card is drawn at random. What is the probability of drawing a card with an even number?

Solution

The cards are numbered 1 to 10.

Sample space:

$$S = \{1,2,3,4,5,6,7,8,9,10\},\; n(S)=10$$

Event $$B$$: drawing an even number.

Favourable outcomes:

$$B = \{2,4,6,8,10\},\; n(B)=5$$

Probability:

\[P(B)=\dfrac{5}{10}=\dfrac{1}{2}\]

Answer

$$\dfrac{1}{2}$$

(iii) A die is rolled once. What is the probability of getting a number greater than 4?

Solution

When one die is rolled:

$$S = \{1,2,3,4,5,6\},\; n(S)=6$$

Event $$C$$: outcome > 4, i.e. $$\{5,6\}$$ so $$n(C)=2$$.

Probability:

\[P(C)=\dfrac{2}{6}=\dfrac{1}{3}\]

Answer

$$\dfrac{1}{3}$$

(iv) A bag contains 3 red balls, 2 blue balls, and 1 green ball. One ball is picked at random. What is the probability that it is not red?

Solution

The bag contains 3 red (R), 2 blue (B) and 1 green (G) ball.

Sample space (by individual balls):

$$S = \{R_1,R_2,R_3,B_1,B_2,G_1\},\; n(S)=6$$

Event $$D$$: ball is not red → blue or green.

Number of favourable balls $$=2+1=3$$, so $$n(D)=3$$.

Probability:

\[P(D)=\dfrac{3}{6}=\dfrac{1}{2}\]

Answer

$$\dfrac{1}{2}$$

(v) Three coins are tossed simultaneously. What is the probability of getting exactly two heads?

Solution

Three coins tossed simultaneously → each coin has H or T, so total outcomes $$2^3=8$$.

Sample space:

$$S = \{HHH,HHT,HTH,HTT,THH,THT,TTH,TTT\}$$

Event $$E$$: exactly two heads.

Favourable outcomes:

$$E = \{HHT,HTH,THH\},\; n(E)=3$$

Probability:

\[P(E)=\dfrac{3}{8}\]

Answer

$$\dfrac{3}{8}$$

5 A bag has 3 candies: strawberry, lemon, and mint. One is picked at random. What is the probability of picking a strawberry candy?

Solution

Step 1 − Identify the sample space
The bag contains three different candies: strawberry, lemon and mint.
Hence the sample space is
$$S = \{\text{strawberry},\;\text{lemon},\;\text{mint}\}$$
So the number of possible outcomes is
$$n(S) = 3$$

Step 2 − Determine the favourable outcomes
The event of interest is “picking a strawberry candy”.
There is only one such outcome:
$$F = \{\text{strawberry}\}$$
Therefore,
$$n(F) = 1$$

Step 3 − Apply the probability formula
For equally likely outcomes,
$$P(F) = \dfrac{n(F)}{n(S)} = \dfrac{1}{3}$$

Result

\[P(\text{strawberry}) = \dfrac{1}{3}\]

Answer

$$\dfrac{1}{3}$$

6 A child has 2 shirts (one red and one blue) and 3 types of pants (jeans, khakis, and shorts). List all the possible combinations of outfits consisting of one shirt and one pair of pants. Display your answer in a table format.

Solution

Step 1 – Identify the two independent choices

  • The child can choose one shirt out of two possibilities: Red (R) or Blue (B).
  • The child can choose one pair of pants out of three possibilities: Jeans (J), Khakis (K), or Shorts (S).

Step 2 – Count the total number of outfits

Because the choice of shirt is independent of the choice of pants, the Fundamental Principle of Counting tells us to multiply the numbers of options:

$$\text{Total outfits}=2 \times 3 = 6$$

Hence, there should be six distinct shirt–pants combinations.

Step 3 – List every possible combination explicitly

S.No.ShirtPants
1RedJeans
2RedKhakis
3RedShorts
4BlueJeans
5BlueKhakis
6BlueShorts

These six rows exhaust all the possible outfits consisting of exactly one shirt and one pair of pants.

Answer

S.No.ShirtPants
1RedJeans
2RedKhakis
3RedShorts
4BlueJeans
5BlueKhakis
6BlueShorts

7

A tyre company records distances before replacement in 1000 cases.

Distance (km)Less than 40004001 to 90009001 to 14000More than 14000
Number of cases20210325445

Find the probability that a randomly chosen tyre lasts:

(i) Less than 4000 km.

Solution

Total number of tyres tested (equally likely outcomes):
$$N = 1000$$

Number of tyres that lasted less than 4000 km:
$$n = 20$$

Required probability

\[P(\text{life } < 4000\,\text{km}) = \frac{n}{N} = \frac{20}{1000} = \frac{1}{50} = 0.02\]

Answer

$$0.02\;\bigl(=\tfrac{1}{50}\bigr)$$

(ii) Between 4000 and 14000 km.

Solution

The distance interval "between 4000 km and 14000 km" covers the two middle classes in the table:

  • 4001 – 9000 km  → 210 cases
  • 9001 – 14000 km  → 325 cases

Total favourable cases:
$$n = 210 + 325 = 535$$

Total number of trials:
$$N = 1000$$

Probability

\[P(4000 \text{ km }< \text{life}\le 14000 \text{ km}) = \frac{535}{1000} = \frac{107}{200} = 0.535\]

Answer

$$0.535\;\bigl(=\tfrac{107}{200}\bigr)$$

(iii) More than 14000 km.

Solution

Number of tyres that lasted more than 14000 km:
$$n = 445$$

Total number of trials:
$$N = 1000$$

Probability

\[P(\text{life } > 14000\,\text{km}) = \frac{445}{1000} = \frac{89}{200} = 0.445\]

Answer

$$0.445\;\bigl(=\tfrac{89}{200}\bigr)$$

8 The letters of the word 'PEACE' are placed on cards. Leela draws a card without looking.

(i) What is the probability that it is a P, E or C?

Solution

Write each letter of the word PEACE on a separate card, so there are 5 cards in all:

$$P,\;E_1,\;A,\;C,\;E_2$$

(The subscripts only help us keep the two E's distinct while counting.)

Total possible outcomes

Number of cards  $$=5$$, hence

$$n(S)=5$$

Favourable outcomes

  • The letter $$P$$ – 1 card
  • The letter $$E$$ – 2 cards ( $$E_1$$ and $$E_2$$ )
  • The letter $$C$$ – 1 card

Total favourable cards  $$=1+2+1=4$$, therefore

$$n(F)=4$$

Required probability

Using $$P(F)=\dfrac{n(F)}{n(S)}$$,

\[P(\text{P, E or C})=\dfrac{4}{5}\]

Answer

$$\dfrac{4}{5}$$

(ii) What is the probability that it is not an E?

Solution

Total possible outcomes

Same experiment: $$n(S)=5$$.

Favourable outcomes

Letters that are not E: $$P,\;A,\;C$$  $$\Rightarrow 3$$ cards.

Thus  $$n(F)=3$$.

Required probability

\[P(\text{not E})=\dfrac{3}{5}\]

Answer

$$\dfrac{3}{5}$$

*9

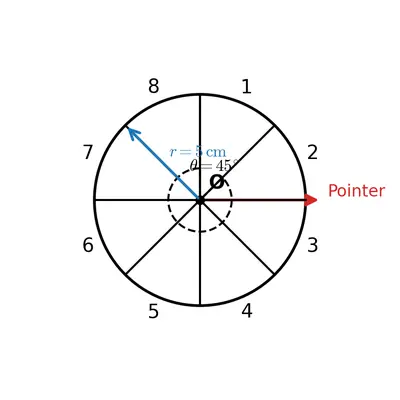
A game of chance consists of spinning an arrow (see Fig. 7.7.) which comes to rest pointing at one of the numbers 1, 2, 3, 4, 5, 6, 7, 8, and these are equally likely outcomes. What is the probability that it will point at
Fig. 7.7
Fig. 7.7

(i) 8?

Solution

Total number of equally likely outcomes (sample space): $$n(S)=8$$ (the numbers 1,2,3,4,5,6,7,8).

Event: arrow points at 8. Favourable outcomes = {8} so $$n(E)=1$$.

Using $$P(E)=\dfrac{n(E)}{n(S)}$$,

\[P(E)=\frac{1}{8}\]

Answer

$$\dfrac{1}{8}$$

(ii) An odd number?

Solution

Sample space size: $$n(S)=8$$.

Odd numbers among 1–8: 1,3,5,7 ⇒ $$n(E)=4$$.

Probability:

\[P(E)=\frac{4}{8}=\frac{1}{2}\]

Answer

$$\dfrac{1}{2}$$

(iii) A number greater than 2?

Solution

Numbers greater than 2: 3,4,5,6,7,8 ⇒ $$n(E)=6$$.

Total outcomes: $$n(S)=8$$.

\[P(E)=\frac{6}{8}=\frac{3}{4}\]

Answer

$$\dfrac{3}{4}$$

(iv) A number less than 9?

Solution

All numbers on the spinner (1–8) are less than 9, so $$n(E)=8$$.

Hence

\[P(E)=\frac{8}{8}=1\]

Answer

1

(v) A multiple of 3?

Solution

Multiples of 3 in 1–8: 3,6 ⇒ $$n(E)=2$$.

Sample space: $$n(S)=8$$.

\[P(E)=\frac{2}{8}=\frac{1}{4}\]

Answer

$$\dfrac{1}{4}$$

*10 A basket contains 4 red balls and 5 blue balls. One ball is drawn and laid aside, and a second ball is drawn. Draw a tree diagram to represent the possible outcomes and probabilities. Use the tree diagram to answer the following questions.

(i) What is the probability of drawing a red ball and then a blue ball?

Solution

Step 1 — First draw (Level 1 of the tree)
The basket contains 9 balls in all (4 red, 5 blue).
Probability of drawing a red on the first draw: $$\frac{4}{9}$$
Probability of drawing a blue on the first draw: $$\frac{5}{9}$$

Step 2 — Second draw after a red (Level 2 on the branch that started with R)
After one red has been removed, 8 balls remain (3 red, 5 blue).
Probability of drawing a blue now: $$\frac{5}{8}$$
Probability of drawing a red now: $$\frac{3}{8}$$

Step 3 — Second draw after a blue (Level 2 on the branch that started with B)
After one blue has been removed, 8 balls remain (4 red, 4 blue).
Probability of drawing a blue now: $$\frac{4}{8}=\frac12$$
Probability of drawing a red now: $$\frac{4}{8}=\frac12$$

Description of the tree diagram:
• Start with one node labelled “Start”.
• Draw two arrows from it. Label one branch “R, $$\tfrac{4}{9}$$” and the other “B, $$\tfrac{5}{9}$$”.
• From the R branch draw two further arrows: “R, $$\tfrac{3}{8}$$” and “B, $$\tfrac{5}{8}$$”.
• From the B branch draw two arrows: “R, $$\tfrac12$$” and “B, $$\tfrac12$$”.
At the ends of the arrows write the corresponding ordered pairs: RR, RB, BR, BB.

Step 4 — Required probability: (Red, then Blue)
Using the multiplication rule along the RB path:
\[P(\text{R then B}) = \frac{4}{9}\times\frac{5}{8}=\frac{20}{72}=\frac{5}{18}.\]

Answer

$$\displaystyle P(\text{red then blue})=\frac{5}{18}$$

(ii) What is the probability of drawing 2 blue balls?

Solution

Refer to the same tree diagram described in part (i).

The path that gives two blue balls in succession is B → B.

Step 1
Probability first ball is blue: $$\frac{5}{9}$$

Step 2
After removing one blue, 8 balls remain (4 red, 4 blue).
Probability the second ball is blue: $$\frac{4}{8}=\frac12$$

Step 3 — Multiply the probabilities
\[P(\text{B then B}) = \frac{5}{9}\times\frac12 = \frac{5}{18}.\]

Answer

$$\displaystyle P(\text{two blue balls})=\frac{5}{18}$$

*11 I throw a pair of 6-sided dice. Write down an event that has a probability of 0 and an outcome that has a probability of 1.

Solution

Step 1 – Sample space.
When a pair of ordinary six-sided dice is thrown, each die can show one of the numbers $$1,2,3,4,5,6$$. Represent an outcome by an ordered pair $$(m,n)$$, where $$m$$ is the number on the first die and $$n$$ that on the second. The sample space is

$$S=\{(1,1),(1,2),\ldots ,(6,5),(6,6)\},\qquad |S|=6\times6=36,$$

and every ordered pair is equally likely, so $$P(\omega)=\dfrac{1}{36}$$ for each $$\omega\in S$$.

Step 2 – An event with probability 0 (an impossible event).
Let

$$A=\{\text{the two dice add up to }13\}.$$

The smallest possible total is $$1+1=2$$ and the largest is $$6+6=12$$, so no ordered pair in $$S$$ has sum 13. Hence $$n(A)=0$$ and

$$P(A)=\dfrac{n(A)}{|S|}=\dfrac{0}{36}=0.$$

Step 3 – An event with probability 1 (a certain event).
Let

$$B=\{\text{each die shows a number from 1 to 6}\}.$$

Because every face of a physical die carries one of the numbers $$1,2,3,4,5,6$$, the statement is true for every ordered pair $$(m,n)\in S$$. Note that $$B$$ is not a single outcome – it is the event consisting of all 36 outcomes, i.e. $$B=S$$ (the certain event). Therefore $$n(B)=36$$ and

$$P(B)=\dfrac{n(B)}{|S|}=\dfrac{36}{36}=1.$$

Conclusion.

  • Event with probability 0: “The sum of the two dice is 13.”
  • Event with probability 1: “Each die shows a number from 1 to 6” – the certain event $$B=S$$, containing all 36 outcomes.

Answer

Event of probability 0: “the sum of the two dice is 13” (impossible event).
Event of probability 1: “each die shows a number from 1 to 6” – the certain event, i.e. the whole sample space $$S$$ (all 36 outcomes), not a single outcome.

*12 Write the sample space and calculate the probability based on the given information.

(i) Two dice are rolled. What is the probability that the sum is a prime number greater than 5?

Solution

Sample space
When two distinguishable dice are rolled, the sample space is the set of 36 ordered pairs
$$S=\{(1,1),(1,2),\ldots ,(6,6)\},\;|S|=36.$$

Favourable sums
A prime number greater than 5 that can be obtained as a sum of two dice is $$7 \text{ or } 11.$$

  • Sum $$7$$: $$(1,6),(2,5),(3,4),(4,3),(5,2),(6,1)\;\Rightarrow\;6$$ outcomes.
  • Sum $$11$$: $$(5,6),(6,5)\;\Rightarrow\;2$$ outcomes.
Thus $$n(E)=6+2=8.$$

Probability

\[P(E)=\dfrac{n(E)}{|S|}=\dfrac{8}{36}=\dfrac{2}{9}\]

Answer

$$\dfrac{2}{9}$$

(ii) A bag contains 4 red, 3 green, and 2 blue balls. Two balls are drawn without replacement. What is the probability that both are of different colours?

Solution

Sample space
Total balls = $$4+3+2=9$$. Two are drawn without replacement, so
$$|S|=\binom{9}{2}=36.$$

Unfavourable (same-colour) selections

  • Both red: $$\binom{4}{2}=6$$
  • Both green: $$\binom{3}{2}=3$$
  • Both blue: $$\binom{2}{2}=1$$
$$n(\text{same colour})=6+3+1=10.$$

Favourable (different-colour) selections

$$n(E)=|S|-10=36-10=26.$$

Probability

\[P(E)=\dfrac{26}{36}=\dfrac{13}{18}\]

Answer

$$\dfrac{13}{18}$$

(iii) Three coins are tossed. What is the probability that the first coin shows heads and exactly two heads occur in total?

Solution

Sample space
Three coins give $$|S|=2^3=8$$ equally likely outcomes.

Conditions for the event
(i) First coin is H.
(ii) Exactly two heads in total.

If the first coin is H, the remaining two coins must contain exactly one more H. The suitable ordered triples are $$HHT,\;HTH.$$ Hence $$n(E)=2.$$

Probability

\[P(E)=\dfrac{2}{8}=\dfrac{1}{4}\]

Answer

$$\dfrac{1}{4}$$

(iv) A four-digit number is formed using the digits 1, 2, 3, and 4 with no repetition. What is the probability that the number is even?

Solution

Sample space
All 4-digit numbers formed from 1,2,3,4 without repetition: $$4!=24.$$

Favourable numbers (even)
An even number must end with 2 or 4.

  • Last digit 2: remaining digits 1,3,4 can be arranged in $$3!=6$$ ways.
  • Last digit 4: remaining digits 1,2,3 can be arranged in $$3!=6$$ ways.
$$n(E)=6+6=12.$$

Probability

\[P(E)=\dfrac{12}{24}=\dfrac{1}{2}\]

Answer

$$\dfrac{1}{2}$$

(v) A student takes a multiple-choice test with 3 questions, each having 4 options (A, B, C, D), with only one correct answer. What is the probability that the student guesses and gets exactly 2 answers correct?

Solution

Sample space.
The student records one option for each of the 3 questions, so an answer sheet is an ordered triple $$(a_1,a_2,a_3)$$ with $$a_i\in\{A,B,C,D\}$$. By the fundamental principle of counting,

$$|S|=4\times4\times4=4^3=64.$$

A few sample points: $$(A,A,A),\,(A,B,C),\,(D,C,B),\,\ldots,\,(D,D,D).$$ Because the student is guessing, all 64 triples are equally likely, each having probability $$\dfrac{1}{64}$$.

Counting the favourable answer sheets (exactly 2 correct).
Let the (fixed but unknown) correct answers be $$(c_1,c_2,c_3)$$. An answer sheet has exactly 2 correct iff exactly two of its entries match $$(c_1,c_2,c_3)$$ and the remaining one does not.

  • Choose which 2 of the 3 positions are correct: $$\binom{3}{2}=3$$ ways.
  • Each of those 2 positions has exactly $$1$$ correct option.
  • The remaining position must be wrong, giving $$3$$ choices (any of the 3 wrong options).

Hence

$$n(E)=\binom{3}{2}\times 1\times 1\times 3=3\times 3=9.$$

Probability.

\[P(E)=\dfrac{n(E)}{|S|}=\dfrac{9}{64}.\]

Equivalently, using the binomial model with $$n=3,\;k=2,\;p=\dfrac{1}{4}$$:

$$P(E)=\binom{3}{2}\left(\dfrac{1}{4}\right)^2\left(\dfrac{3}{4}\right)^1=3\times\dfrac{1}{16}\times\dfrac{3}{4}=\dfrac{9}{64}.$$

Answer

$$\dfrac{9}{64}$$

*13 A box contains 4 balls numbered 1 to 4. Record a sample space using a tree diagram for the following experiments:

(i) A ball is drawn, and the number is recorded. Then the ball is returned, and a second ball is drawn and recorded.

Solution

The balls are numbered $$1,2,3,4$$.

Step 1 – First draw
From the common starting point (root) draw four branches labelled $$1,2,3,4$$. Any of these numbers can appear on the first ball.

Step 2 – Replace and draw again
Because the first ball is put back, the second draw is made from the same four balls. Hence from the end of each first-stage branch draw another set of four branches, again labelled $$1,2,3,4$$.

The tree therefore has two stages, each with 4 branches. Reading the numbers along every complete path gives all ordered pairs $$\bigl(\text{first draw},\text{second draw}\bigr)$$:

$$\begin{aligned} S_1 &={} \{(1,1),(1,2),(1,3),(1,4),\\ &\quad (2,1),(2,2),(2,3),(2,4),\\ &\quad (3,1),(3,2),(3,3),(3,4),\\ &\quad (4,1),(4,2),(4,3),(4,4)\}.\end{aligned}$$

Because there are $$4\times4=16$$ paths, $$|S_1|=16$$.

Answer

$$S_1=\{(1,1),(1,2),(1,3),(1,4),(2,1),(2,2),(2,3),(2,4),(3,1),(3,2),(3,3),(3,4),(4,1),(4,2),(4,3),(4,4)\}$$

(ii) A ball is drawn and recorded. Without replacing the first ball, the experimenter draws and records a second ball.

Solution

Without replacement means that after the first ball is drawn, it is not returned to the box.

Step 1 – First draw
As before, start with four branches labelled $$1,2,3,4$$.

Step 2 – Second draw
From the end of each first-stage branch draw only three branches, because the ball already removed cannot appear again.

  • After a first-draw $$1$$, the second-stage branches are $$2,3,4$$.
  • After a first-draw $$2$$, the branches are $$1,3,4$$; and so on.

Reading every full path gives all ordered pairs with different numbers:

$$\begin{aligned} S_2 &={} \{(1,2),(1,3),(1,4),\\ &\quad (2,1),(2,3),(2,4),\\ &\quad (3,1),(3,2),(3,4),\\ &\quad (4,1),(4,2),(4,3)\}.\end{aligned}$$

There are $$4\times3=12$$ paths, so $$|S_2|=12$$.

Answer

$$S_2=\{(1,2),(1,3),(1,4),(2,1),(2,3),(2,4),(3,1),(3,2),(3,4),(4,1),(4,2),(4,3)\}$$

(iii) What are the sizes of these two sample spaces?

Solution

The sizes calculated above are

$$|S_1|=16, \quad |S_2|=12.$$

Answer

Size with replacement: 16
Size without replacement: 12

*14 List the elements of a sample space for the simultaneous tossing of a coin and drawing of a card from a set of 6 cards numbered 1 through 6.

Solution

Step 1 – Identify every basic outcome separately
A single toss of a fair coin can land in only two ways:
$$H$$  (Head) or $$T$$  (Tail).

The experiment of drawing one card from the six numbered cards gives six possible results:
$$1,\;2,\;3,\;4,\;5,\;6.$$

Step 2 – Form ordered pairs for the combined experiment
Because the coin is tossed at the same time as the card is drawn, we record both results in the order
$$\text{(coin outcome, card number)}.$$

The Fundamental Principle of Counting tells us that the total number of possible ordered pairs is
$$2 \times 6 = 12.$$

Step 3 – List all 12 ordered pairs
Starting with the coin showing Head (H):
$$ (H,1),\;(H,2),\;(H,3),\;(H,4),\;(H,5),\;(H,6). $$
Then with the coin showing Tail (T):
$$ (T,1),\;(T,2),\;(T,3),\;(T,4),\;(T,5),\;(T,6). $$

Step 4 – Write the complete sample space

\[ S = \{(H,1),(H,2),(H,3),(H,4),(H,5),(H,6),\; (T,1),(T,2),(T,3),(T,4),(T,5),(T,6)\} \]

The set $$S$$ contains every possible outcome of the simultaneous tossing of the coin and drawing of one numbered card, so it is the required sample space.

Answer

$$S = \{(H,1),(H,2),(H,3),(H,4),(H,5),(H,6),(T,1),(T,2),(T,3),(T,4),(T,5),(T,6)\}$$

*15 Three coins are tossed, and the number of heads is recorded. Which of the following lists is a sample space for this experiment? Why do the other lists fail to qualify as a sample space?

(i) $$\{1, 2, 3\}$$

Solution

When three coins are tossed, each coin shows either a head (H) or a tail (T).
Let us list all the eight equally–likely outcomes first:

HTH, THH, HHT, HHH, TTT, TTH, THT, HTT.

Now we convert each outcome into the number of heads it contains:

  • HTH, THH, HHT, HHH → 2, 2, 2, 3 heads respectively,
  • TTT → 0 head,
  • TTH, THT, HTT → 1, 1, 1 head respectively.

Hence the possible numbers of heads are exactly
$$0,\;1,\;2,\;3.$$

A set that is to serve as the sample space must

  • contain every possible result (exhaustive), and
  • contain only possible results (mutually exclusive with no extras).

The proposed set here is $$\{1,2,3\}.$$(i) This set does not include the outcome ‘0 heads’. Therefore it is incomplete and cannot be the sample space.

Answer

Fails — the outcome 0 heads is missing.

(ii) $$\{0, 1, 2\}$$

Solution

The correct list of possible numbers of heads is $$0,1,2,3.$$

The proposed set here is $$\{0,1,2\}.$$(ii) It leaves out the result ‘3 heads’ (HHH). Hence it is not exhaustive and cannot serve as the sample space.

Answer

Fails — the outcome 3 heads is missing.

(iii) $$\{0, 1, 2, 3, 4\}$$

Solution

The allowable numbers of heads are again $$0,1,2,3.$$

The proposed set here is $$\{0,1,2,3,4\}.$$(iii) The entry ‘4’ can never occur because at most three heads are possible when only three coins are tossed. Thus the set contains an impossible outcome and is therefore not a valid sample space.

Answer

Fails — it includes the impossible outcome 4 heads.

(iv) $$\{0, 1, 2, 3\}$$

Solution

The proposed set here is $$\{0,1,2,3\}.$$(iv) This set lists exactly the four possible counts of heads:

  • 0 heads (TTT)
  • 1 head (TTH, THT, HTT)
  • 2 heads (HTH, THH, HHT)
  • 3 heads (HHH)

It is both exhaustive and contains no impossible value, so it does qualify as a legitimate sample space.

Answer

Valid sample space.

*16

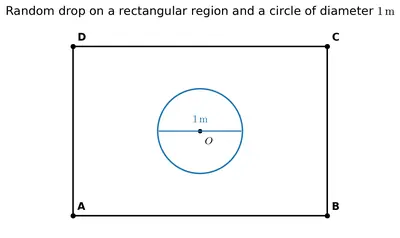
Suppose you drop a dye at random on the rectangular region shown in Fig. 7.8. What is the probability that it will land inside the circle with a diameter of 1 m?
Fig. 7.8
Fig. 7.8

Solution

Step 1 – Identify the sample space
The dye may fall anywhere on the rectangle shown in Fig. 7.8. Hence the whole rectangle is the sample space. Let its length be $$3\,\text{m}$$ and its breadth be $$2\,\text{m}$$ (as given in the figure).
Area of the rectangle
$$A_{\text{rect}} = \text{length} \times \text{breadth} = 3 \times 2 = 6\,\text{m}^2$$

Step 2 – Identify the favourable region
The favourable region is the circle drawn inside the rectangle. Its diameter is given as $$1\,\text{m}$$, so
$$\text{radius } r = \frac{1}{2}\,\text{m} = 0.5\,\text{m}$$
Area of the circle
$$A_{\text{circle}} = \pi r^{2} = \pi(0.5)^2 = 0.25\pi\,\text{m}^2$$

Step 3 – Compute the probability
When every point of the rectangle is equally likely, the required probability equals the ratio of the favourable area to the total area:
\[ P(\text{landing inside the circle}) = \frac{A_{\text{circle}}}{A_{\text{rect}}} = \frac{0.25\pi}{6} = \frac{\pi}{24} \]
Numerically, using $$\pi \approx 3.14$$,
$$P \approx \frac{3.14}{24} \approx 0.13$$

Hence, the probability that the dye will land inside the circle is $$\displaystyle \frac{\pi}{24}\; (\text{about }0.13).$$

Answer

$$\displaystyle P = \frac{\pi}{24} \;\approx\; 0.13$$

NCERT Solutions for Class 9
Maths
NCERT Solutions for Class 9 Maths
Chapter-wise step-by-step
solutions with explanations
explore solutions Maths bg
Science
NCERT Solutions for Class 9 Science
Chapter-wise step-by-step
solutions with explanations
explore solutions Science bg

50,000+ JEE Students Trusted Our Score Calculator

Predict your JEE Main percentile, rank & performance in seconds