According to the passage, the steel industry in India has grown by ................. in the past two years and India ranks ................. among steel-producing countries.
MAT 2008 Question Paper
Answer these Question ns based on the passages.
Passage I
The Indian steel industry, in line with global trends, is at a crossroads, witnessing a resurgent phase of modernization, expansion and consolidation, mainly through mergers and acquisitions. A sector that was moribund just about five years ago because of a worldwide slump in steel prices, the industry has turned the corner and has in fact been vibrant over the past two years. Domestic steel companies, both public and private, are surging ahead on the strength of an unprecedented buoyancy in the economy and the resultant boom in real estate and various infrastructure sectors such as roads and highways, ports and airports. The official figures speak for themselves. Powered by an increased demand for steel from neighbouring China, which has been clocking a 15 per cent sectorial growth annually on account of construction projects in preparation for the Olympics, the steel industry in India has grown by about 10 per cent in the past two years, compared with the global growth rate of about 6 per cent a year. The country’s production of crude steel in 2005-06 stood at 42.1 million tonnes, reflecting an increase of per cent over the previous fiscal. On the other hand, the consumption of steel during the year was pegged at 41.43 million tonnes, a massive growth of 13.88 per cent when compared with the 2004-05 figures. Likewise, the production of sponge iron also increased sharply by 25 percent, from about 10.3 million tonnes in 2004-05 to 12.9 million tonnes in 2005-06. Currently, India is the largest sponge iron producer in the world and ranks seventh among steelproducing countries. The growth in domestic steel consumption is, by and large, in keeping with the International Iron and Steel Institute (IISI) forecast of a 10 percent increase in steel use in 2006. While the IISI has projected the global demand for steel to grow by 4.9 per cent in the medium term up to 2010, it has pegged its forecast for the 2010-15 period at 4.2 per cent annually for the entire world. The IISI says India will lead the consumption growth story with an annual demand of 7.7 per cent, followed by China with 6.2 per cent. More heartening is the indication that the exciting phase in the domestic steel industry is expected to continue for the next five to seven years at the least, in terms of both consumption and production. Already, the growth in steel consumption, as projected by the United Progressive Alliance (UPA) government in the National Steel Policy (NSP) formulated in 2005, stands exceeded by a huge margin. The NSP had conservatively estimated the country’s steel production to grow by 7.3 per cent, with an annual consumption growth of 6.9 per cent. Considering that the past two years have already witnessed a demand growth of over 10 per cent, the government expects the healthy trend to continue during the Eleventh Plan period (2007-12), provided an annual gross domestic product (GDP) growth of 9 per cent is achieved during the period as projected by the Planning Commission. Clearly, for primary steel producers, India is the place to be in as it has the greatest growth potential. Coupled with this are two other major factors. One, India is bestowed with the largest reserves of high-quality ironore in the world. Secondly, the annual per capita consumption of steel in the country is still one of the lowest in the world, at 35 kilograms against the global benchmark of 250400 kg. In effect, the growth story in India is here to stay for quite a few decades in view of the sheer disparity in consumption levels. Not surprising, then, that when the three ore-rich states - Jharkhand, Orissa and Chhattisgarh- threw open their doors, steel-makers of all hues jumped into the fray to sign memoranda of understanding (MoUs) with more than one state government. In all, more than 116 MoUs have already been inked, pledging a total investment of a whopping Rs 3,57,344 crores in the coming years. If all the pledges materialise, the country’s installed steel production capacity will surge to anywhere between 150 million and 180 million tonnes by 2014-15, compared with the conservative NSP target of 110 million tonnes by 2019-20. Orissa signed 43 MoUs to hike its production capacity to 58.04 million tonnes. Not to be left behind, Chhattisgarh entered into 42 MoUs to augment its steel capacity to 19.32 million tonnes, while Jharkhand signed 31 MoUs to increase its capacity to 68.67 million tonnes. The extensive availability of rich iron-ore- the basic raw material for steel-making - in the three states has attracted big global names too who, at the outset, made it clear that they would require captive iron-ore mines to feed their greenfield steel projects. Initially, it was the home-grown Tata Steel that signed an MoU with the Orissa government, in November 2004 for setting up a six-million-tonne plant at an estimated cost of Rs 15,400 crores after the government made a commitment that its ore requirement of 250 million tonnes for a period of 25 years would be met. by the time Pohang Iron and Steel Company (POSCO), the South Korean major and third largest global steel producer, approached the Orissa government, the terms turned out to be far sweeter. Under the MoU signed in June 2005, POSCO plans to set up a 12-million-tonne plant at Paradeep, with an investment of Rs 51,000 crores. The initial proposal was for a 10-milliontonne plant. but there is a catch here. The government has committed itself not only to provide 600 million tonnes of ore on a captive basis for a period of 30 years but also allowing POSCO to export the quality domestic ore for use in its steel plants in Korea. It has demanded the raw material from mines in Sundergarh and Keonjhar districts. Lakshmi N Mittal, the non-resident Indian (NRI) tycoon and world’s biggest steel-maker following the merger of Mittal Steels with the Luxembourg-based Arcelor in June last year, did still better. He put Jharkhand and Orissa in competition by proposing a steel venture in either state, depending upon the terms and incentives and the swiftness in approvals. Jharkhand lost out-owing to litigation over its Chiraia ore mines and for other reasons - to Orissa, which signed an MoU with Mittal Arcelor in December last year for a 12-million-tonne steel plant at Keonjhar.
The state-owned Steel Authority of India Limited (SAIL) also undertook a major exercise to retain its position as the leading integrated steel producer in the country. The steel behemoth announced its “Corporate Plan- 2012,’ envisaging an outlay of Rs. 37,000 crores to upgrade its plants and modernise its operations. Under the plan, expansion programmes are under way in various SAIL units to enhance the total production capacity to 22.9 million tonnes of hot metal from the present 12.5 million tonnes by 2011-12. Late last year, following the merger of IISCO with SAIL, Prime Minister Manmohan Singh laid the foundation stone for the modernisation and expansion of ISP (IISCO Steel Plant) with an investment of Rs 9,592 crores. Mergers of a few more state-owned units with SAIL are on the cards with a view to consolidating public sector share in the steel market. The other public sector steel enterprise, Rashtriya Ispat Nigam Ltd (RINL), is already in the process of implementing an ambitious expansion programme for increasing its liquid steel capacity from the current three million tonnes to 6.3 million tonnes at an estimated cost of Rs 8,692 crores. Launched on May 20, 2006, the project is scheduled for completion by 2008-09. Needless to say, the demand for iron-ore has surged in view of the long-term supply commitments being given by the State governments at a time when the international market prices for the raw material are at a high.
This sparked off a debate among domestic steel-makers on whether liberal ore exports should he permitted, as in the past, or the ore should be conserved to the extent possible in view of the projected demand for steel. The government set up a committee under the Planning Commission, headed by Anwarul Hoda, to recommend changes in the National Mineral Policy. The existing policy permits free exports of iron ore with a ferrous content of less than 64 per cent. For export of high-grade ore with higher ferrous content, a licence is required and is currently canalised through the Minerals and Metals Trading Corporation (MMTC). The Hoda Committee recommended free exports of iron ore with a ferrous content of less than 65 per cent but advocated discontinuation of the existing regime of canalisation and export licensing for the high-grade ore. Instead, the panel suggested free exports of quality ore lumps with ferrous content of more than 65 per cent on payment of an export duty.
............. per cent is the projected global demand for steel to grow in the medium term up to 20 10.
According to the International Iron and Steel Institute, India will lead the consumption growth with an annual demand of .............. per cent, followed by China with percent.
Which one of the following statements is incorrect?
Answer these Question ns based on the passages.
Passage II
P. Chidambaram might have rubbed Corporate India the wrong way by putting the big-bang reforms on the backburner, but he has definitely tried to buy peace with the aam aadmi by increasing investment in big-ticket projects like bharat Nirman and National Rural Employment Guarantee Programme (NREG). While the outlay for bharat Nirman has been hiked by 31.6%, allocations for the education sector and health and family welfare schemes have gone up by 34:2% and by 21.9%, respectively. Chidambaram also surprised many by increasing the education cess to 3%, from 2%, to fund secondary and higher education. The government also proposed to increase funding for the midday meal scheme from the primary level to the upper primary classes in 3,427 educationally backward blocks. However, it has pruned allocation for the Sarva Shiksha Abhiyan (SSA) - a scheme started by the NDA government. To arrest the dropout ratio after eighth standard, a means-cum-merit scholarship scheme covering one lakh students has been announced. The first year of the Eleventh Plan period will also see the appointment of two lakh teachers and construction of five lakh classrooms.
As the saying goes, well begun is half done. but how many of these noble intentions will translate into actions? There are many unanswered Question ns. One, are the increased outlays enough to achieve the social goals enumerated in the UPA government’s common minimum programme (CMP)? Two, is the greater allocation to the flagship programmes in proportion to the GDP growth? And more importantly, will the increased allocation also fix the lacuna in the delivery mechanism? The CMP, for instance, has set a 6% target for education spend (as a proportion of the GDP). However, the spend has hardly touched the halfway mark as the coalition government moves closer to the end of its tenure. The education cess has also been swelling the general pool without any firm commitment from the government on incremental spending to meet specific objectives. Experts also Question n the success of the bharat Nirman project touted as “the cornerstone of the UPA government’s policies” to fight rural poverty. The IDFC, for instance, raises doubts about the sustainability of the project in its India Infrastructure Report 2007. According to Prof Jean Dreze, one of the architects of the NREG and member of the Central Employment Guarantee Council, the two big disappointments in the budgets are the allocations for Integrated Child Development Services (ICDS) and the Rural Employment Scheme.
“Both are virtually unchanged as a proportion of GDP. If anything, they have declined,” points out Dreze. The universalisation of ICDS, one of the core commitments of the CMP, assumes importance from another angle. The Supreme Court in a December 2006 directive called for the doubling of operational anganwadis by 2008 and wanted the government to ensure that all ICDS services be extended to all children under six. “This cannot be done without increasing financial allocations. The absence of any such increase in the budget is an alarming indication of lack of political commitment to this programme. It is also, in effect, a violation of the court’s order,” he says.
In the case of Rural Employment Guarantee Schemes, it was estimated by the now-defunct National Advisory Council (NAC) that at least around Rs 20,000 crores would be required for the fair implementation of the NREG Act in the country’s 200 poorest districts. However, only Rs 6,000 crores has been spent as of January 2007 and the implementation is also tardy in many states, says Dreze “The need of the hour is not only to expand the number of districts covered by NREGA, but also to raise expenditure levels much close, to the NAC projections. Instead of this, the government proposes to extend NREGA to 330 districts without any increase in expenditure. This is another sobering indication of lack of commitment to flagship programmes and to the rural poor,” says Dreze. TV Mohandas Pai, Director and HR Chief, Infosys, says that the government, instead of so many incremental steps, should have undertaken certain path-breaking initiatives in irrigation and health insurance for the poor. “The government should think of revolutionary steps to catapult the economy into a much higher orbit. For instance, the subsidies for food, fertilizers, kerosene and LPG, which account for about Rs 75,000 crore, can be done away with, and instead, a direct income transfer of Rs 1,000 each, to say 10 crore below-poverty-line families, which the government has already identified, could have been done,” he says. This way, at one stroke, nearly 50 crore people (assuming five people in a family) will get a kind of social security, Pai argues.
While it is debatable whether the government would go in for such innovative methods to address social inequalities, a reality check would be in order. Otherwise, the ghost of India Shining would come back to haunt the UPA government as well.
Which one ofthe following statements is incorrect?
Which one ofthe following statements is/are true?
Experts Question n the success of the bharat Nirman project touted as the cornerstone of the UPA government’s policies to
In the case of Rural Employment Guarantee Schemes, it is estimated by the now-defunct National Advisory Council (NAC) that at least around ................crore would be required for the fair implementation of the NREG Act in the country’s 200 poorest districts.
Answer these Question ns based on the passages.
Passage III
All men by nature, desire to know. An indication of this is the delight we take in our senses: for even apart from their usefulness they are loved for themselves; and above all others, the sense of sight. For not only with a view to action, but even when we are not going to do anything, we prefer seeing (one might say) to everything else. The reason is that this, most of all the senses, makes us know and brings to light many differences between things. by nature, animals are born with the faculty of sensation, and from sensation, memory is produced in some of them, though not in others. And therefore, the former are more intelligent and apt at learning than those which cannot remember; those which are incapable of hearing sounds are intelligent though they cannot be taught, e.g. the bee and any other race of animals that may be like it; and those which, besides memory, have this sense of hearing can be taught. The animals other than man live by appearances and memories, and have but little of connected experience; but the human race lives also by art and reasonings. Now from memory, experience is produced in men; for the several memories of the same thing produce finally the capacity for a single experience. And experience seems pretty much like science and art, but really, science and art come to men through experience; for ‘experience made art’, as Polus says, ‘but inexperience luck.’ Now art arises, when from many notions gained by experience, one universal judgement about a class of objects is produced. For to have a judgement that when Callias was ill of this disease that did him good, and similarly, in the case of Socrates and in many individual cases, is a matter of experience; but to judge that it has done good to all persons of a certain constitution, marked off in one class, when they were ill of this disease, e.g. to phlegmatic or bilious people when burning with fevers - this is a matter of art.
With a view to action, experience seems in no respect inferior to art, and men of experience succeed even better than those who have theory without experience. (The reason is that experience is knowledge of individuals, art of universals, and actions and productions are all concerned with the individual; for the physician does not cure man, except in an incidental way, but Callias or Socrates or some other, called by some such individual name, who happens to be a man. If, then, a man has the theory without the experience, and recognizes the universal but does not know the individual included in this, he will often fail to cure; for it is the individual that is to be cured.) but yet we think that knowledge and understanding belong to art rather than to experience, and we suppose artists to be wiser than men of experience (which implies that wisdom depends in all cases rather on knowledge); and this because the former know the cause, but the latter do not. For men of experience know that the thing is so, but do not know why, while the others know the ‘why’ and the cause. Hence we think also that the master workers in each craft are more honourable and know in a truer sense and are wiser than the manual workers, because they know the causes ofthe things that are done (we think the manual workers are like certain lifeless things which act indeed, but act without knowing what they do, as fire bums, but while the lifeless things perform each of their functions by a natural tendency, the labourers perform them through habit); thus we view them as being wiser not in virtue of being able to act, but of having the theory for themselves and knowing the causes. And in general, it is a sign ofthe man who knows and ofthe man who does not know, that the former can teach, and therefore, we think art is more truly knowledge than experience is; for artists can teach, and men of mere experience cannot.
Again, we do not regard any of the senses as Wisdom; yet surely these give the most authoritative knowledge of particulars. but they do not tell us the ‘why’ of anything, e.g. why fire is hot; they only say that it is hot. At first, he who invented any art whatever, that went beyond the common perceptions of man was naturally admired by men, not only because there was something useful in the inventions, but because he was thought wiser and superior to the rest. but as more arts were invented, and some were directed to the necessities of life, others to recreation, the inventors of the latter were naturally always regarded as wiser than the inventors of the former, because their branches of knowledge did not aim at utility.
Hence, when all such inventions were already established, the sciences which do not aim at giving pleasure or at the necessities of life were discovered, and first in the places where men first began to have leisure. This why the mathematical arts were founded in Egypt; for there the priestly caste was allowed to be at leisure. We have said in the Ethics what the difference is between art and science and the other kindred faculties; but the point of our present discussion is this, that all men suppose what is called Wisdom to deal with the first causes and the principles of things; so that, as has been said before, the man of experience is thought to be wiser than the possessors of any sense-perception what ever, the artist wiser than the men of experience, the masterworker than the mechanic, and the theoretical kinds of knowledge to be more of the nature of Wisdom than the productive. Clearly then, wisdom is knowledge about certain principles
and causes.
What is the relationship between sensation and memory?
Solution
In the passage, it is mentioned that sensation in animals can lead to memory in some, and that from memory, experience is produced in humans. This experience is connected and helps in forming reasoning.
Hence, the relationship between sensation and memory is that when sensation is remembered, it leads to an experience, which connects various memories and, in turn, gives rise to reasoning and understanding.
What is the difference between art and experience?
Why, according to the author, were the mathematical arts founded in Egypt?
Which of the following can be considered to be the central idea of the passage?
Answer these Question ns based on the passages.
Passage IV
There are a few instances of diseases that have laid waste huge tracts of forests throughout India. Caused mainly by pathogens and pests, these diseases are deadly and are capable of wiping out entire forests and plantations, causing immense economic as well as ecological loss.
Meanwhile, forest pathologists and entomologists are grappling with new maladies that are surfacing almost every year. but with meagre resources and just a few experts working on the issue, things are heading virtually towards a culde-sac.
Moreover, no assessment has been made so far to quantify the devastation. While large chunks of forests fall prey to maladies, it is also an opportunity for some politician and timber merchants to cash in on it. Research and documentation on forest disease, particularly on forest pathology, began in India way back in 1929, by pioneering pathologists KD bagchi and bK bagchi. Although it has been eight decades since then, not much headway has been made in this; direction. The forestry sector today is ailing due to its misplaced priorities, resource crunch, and mismanagement. “Forest management lacks scientific approach,” says Surendra Kumar, director of the Himalayan Forest Research Institute (HFRI), Shimla.
The scientific community involved with forest diseases is today a dispirited lot. With only a few stalwarts left in this field, forest disease is a neglected area of research. Moreover, bureaucracy is increasingly taking over the scientific institutions and scientists in most of these institute arc a marginalised group.
To top it all, there are no institutions dedicated to forest diseases. Although the ministry of environment and forests is the facilitator for such research, it is not paying enough attention to promote scientific research of forest diseases;. In fact, the government’s lackadaisical approach came to the fore with the Sal borer epidemic in Madhya Pradesh in 1998. While forest bureaucracy slept, the beetles merrily continued to wipe out entire tracts of precious Sal forests. Eventually, with no solution in sight, thousands of valuable trees were hacked. There were also allegations that the Sal tragedy was a chance for the timber mafia in the state to cash in on timber through the legal loophole, with the nexus of politicians.
Today, things haven’t changed one bit. India’, forest department and research institutes have yet to formulate contingency plans to face any assault of similar dimensions.
Forest diseases are elusive. Although experts claim that they know quite a lot about forest diseases, there are still aspects of the maladies that are not completely understood. Says RS bhandari, entomologist in the Forest Research Institute (FRI), Dehradun, “We know about all the important pests and insects, their life cycles and their development. but there are a few diseases which remain an enigma.” According to Jamaluddin, head of the pathology department in the Tropical Forest Research Institute (TERI), Jabalpur, “Due to micro climatic changes, we are discovering new aspects of the same disease every year. Diseases have also increased manifold.” Another FRI scientist points out that although forest diseases are increasing, there is no study to estimate the economic and ecological damage caused by these pests and pathogens.
Varying with different geophysical regions and climatic conditions, pathogens and pests are essentially responsible for the tree maladies and their mortality. When the pristine, natural and mixed forests existed, forest diseases acted as a natural control measure to check the proliferation of a particular species that could threaten the balance of the ecosystem.Perhaps, this is why forest diseases paled into insignificance in the past. but today, with shrinking forests and increasing monoculture plantations, any outbreak of disease takes on a virulent form.
To top this, changed climatic and forest patterns and environmental pollution have given rise to newer forms of forest diseases. While trees are forced to take an additional load of human-induced environmental changes, the introduction of mono culture has substantially increased the problems. Whatever little we know about forest diseases today comes primarily through mycology, the study of forest pathogens. Mycology explains that the prime pathological reasons for forest disease are fungi, bacteria and viruses. “Among these, fungi playa major role, while the other two are relatively less significant. There are 150 to 200 major pathological infections in central India. Out of these, only five per cent are bacterial. The rest are fungal,” says Jamaluddin.
Most of these pathogens stay close to a tree, waiting for a chance to infiltrate. Their entry points are small openings or wounds in the tree. However, invasion is not always easy. Like human beings, trees also have antibodies that fight anything alien. In case of invasion from the trunk of a tree, the sapwood acts as a shield and secretes enzymes to fight pathogens. but when attacked and conquered, there are tell-tale signs in the form of knotty growths of fruit bodies that are extensions of the fungi in the tree.
Which of the following is the author most likely to agree with?
Which of these incidents discourages the government to formulate any kind of concrete plans?
Which of these statements cannot be inferred from the passage?
The discussion on the present condition of forestdiseases proves that
Answer these Question ns based on the passages.
Passage V
For years, the contents of a child’s sandbox have confounded some of the nation’s top physicists. Sand and other granular materials, such as powders, seeds, nuts, soils, and detergent, behave in ways that seem to undermine natural laws and cost industries ranging from pharmaceuticals to agribusiness and mining, billions of dollars.
Just shaking a can of mixed nuts can show you how problematic granular material can be. The nuts do not ‘mix’; they ‘unmix’ and sort themselves out, with the larger brazil nuts on top and the smaller peanuts at the bottom. In this activity and others, granular matter’s behaviour apparently goes counter to the second law of thermodynamics, which states that entropy, or disorder, tends to increase in any natural system.
Mimicking the mixed-nut conundrum with a jar containing many small beads and one large bead, one group of physicists claimed that vibrations causing the beads to percolate open up small gaps rather than larger ones. Thus, when a brazil nut becomes slightly airborne, the peanuts rush in underneath and gradually nudge it to the top. Another group of physicists colour coded layers of beads to track their circulation in a container and achieved a different result. Vibrations, they found, drive the beads in circles up the centre and down the sides of the container. Yet downward currents, similar to convection currents in air or water, are too narrow to accommodate the larger bead, stranding it on top.
One industrial engineer who has studied the problem says that both the ‘percolation’ and ‘convection current’ theories can be right, depending upon the material, and that percolation is the major factor with nuts. Given the inability of scientists to come up with a single equation explaining unmixing, you can see why industrial engineers who must manage granular materials go a little, well, ‘nuts’! Take Pharmaceuticals, for instance. There may be six types of powders with differentsized grains in a single medicine tablet. Mixing them at some speeds might sort them, while mixing at other speeds will make them thoroughly amalgamated. One aspirin company still relies on an experienced employee wearing a latex glove who pinches some powder in the giant mixing drum to see if it ‘feels right’.
Granular material at rest can be equally frustrating to physicists and engineers. Take a tall cylinder of sand. Unlike a liquid, in which pressure exerted at the bottom increases in direct proportion to the liquid’s height, pressure at the base of the sand cylinder doesn’t increase indefinitely. Instead, it reaches a maximum value and stays there. This “quality allows sand to trickle at a nearly constant rate through the narrow opening separating the two glass bulbs of an hourglass, thus measuring the passage of time.
Physicists have also found that forces are not distributed evenly throughout granular material. It is this characteristic that may account for the frequent rupturing of silos in which grain is stored. In a silo, for instance, the column’s weight is carried from grain to grain along jagged chains. As a result the container’s walls carry more of the weight than its base, and the force is significantly larger at some points of contact than at others. Coming up with equations to explain, much loss, predict the distribution of these force chains” is extremely difficult.
Again, using beads, physicists developed a simple theoretical model in which they assume that a given bead transmits the load it bears unequally and randomly onto the three beads on which it rests. While the model agrees well with experimental results, it does not take into account all of the mechanisms of force transmission between grains of sand or wheat.
In the struggle to understand granular materials, sand-studying physicists have at least one thing in their favour. Unlike particle physicists who must secure billions of dollars in government funding for the building of super-colliders in which to accelerate and view infinitesimal particles, they can conduct experiments using such low-cost, low-tech materials as sand, beads, marbles, and seeds. It is hoped that more low-tech experiments and computer simulations will lead to equations that explain the unwieldy stuff and reduce some of the wastage, guesswork, and accidents that occur in the various industries that handle it.
The percolation theory of unmixing is bout illustrated by which of the following examples?
In saying that the percolation and convection current theories may both be right, the industrial engineer means that.
Which of the following appears to be the best solution for combating the ‘unmixing’ problem faced by pharmaceutical manufacturers that must prepare large quantities of powders?
The passage implies that if the top bulb of an hourglass were filled with water instead of sand the pressure pushing the water through the opening would
Choose the correct option for the given blanks.
Pipes are not a safer ............ to cigarettes because, though pipe smokers do not inhale, they are still .......... higher rates of lung and mouth cancers than non-smokers.
because of its tendency to ............... most Indian art is.............. Japanese art, where symbols have been minimized and meaning has been conveyed by using the method of the merest suggestion.
Solution
A) Overdraw - similar to → "Overdraw" means exaggerating or making something excessive, but if Indian art is exaggerated, it would not be "similar to" Japanese art, which is subtle. (Incorrect )
B) Understate - reminiscent of → "Understate" means presenting something in a subtle or minimal way, which aligns with the description of Japanese art. "Reminiscent of" means that Indian art resembles Japanese art in this way. This fits well. (Correct )
C) Imitate - superior to → If Indian art imitates something, it should resemble that thing. However, saying it is "superior to" Japanese art contradicts the idea of similarity. (Incorrect )
D) Sentimentalism - supportive of → "Sentimentalism" means being overly emotional, which doesn't fit the context of artistic style comparison. (Incorrect )
In the absence of native predators, to stop the spread of their population, the imported goats............to such an inordinate degree that they over-grazed the countryside and ............. the native vegetation.
The analysis of anything but ........ the coach’s report was but those of us who have learned to discount such dismal ................ are optimistic.
Each of these Question ns has a set of four sentences marked A to D. Identify the arrangement of these sentences which makes a logical sequence.
(A) It marks off the beginning mathematics from what went before.
(B) Ever since this discovery, abstraction has been a major theme in the development of mathematics, as those interested in the field have come up with ideas further and further divorced from their basis in the real world, and then sought ways to bring them back to tell us things about the real world which we might otherwise not have known.
(C) The discoverer of abstraction was the person who first realized that numbers are independent of the objects being counted, that two oranges and two apples (for instance) share a property, ‘twoness’, which is independent of what kinds of fruit they are.
(D) Abstraction, the action of divorcing properties of physical objects from the objects themselves, is a fundamental concept, perhaps the most fundamental concept, in mathematics.
(A) The accomodation theory, in linguistics, starts from the premise that speech accommodation takes place when people modify their speech so that it conforms more with the way their conversational partners speaks.
(B) For example, the speed at which people talks, the length of both pauses and utterances, the kind of vocabulary and syntax used, as well as intonation, voice pitch and pronunciation are all subject to the accommodation process.
(C) A wide range of subtle adaptations have been observed, which tend to occur more or less unconsciously.
(D) This kind of convergence is by no means an automatic feature of all conversations, and we can discern certain social contexts in which accommodation can be predicted.
(A) fossil evidence suggests that the mammals underwent adaptive radiation to produce the range of mammal types extant today.
(B) Adaptive radiation, in the life sciences, refers to the differentiation (or anagenesis) of one or a few species into many to fill a large number of related ecological niches by adaptation.
(C) Thus the first bird species may have given rise to many more bird species by adaptive radiation.
(D) Typically, a species adapts to colonize a new habitat and, this adaptation opening up a new range of niches, adapts again to fill the new niches which are presented.
Solution
The topic of discussion is Adaptive radiation, which is introduced in B.
D explains that this adaptation gives rise to new variants, and C gives the consequence of this adaptation by saying that the species that roamed around a lot and were present at the earliest of times would have given rise to many species. And A tells the long-term consequence, that the adaptation of early mammals could have led to the species today.
Making BDCA the most logical sequence.
Therefore, Option B is the correct answer.
(A) When the future date arrives, the hear expects to buy in at a lower price deliver the stock that had been sold under the future contract at a higher price.
(B) A market in which prices are falling or are expected to fall is called by economists a bear market.
(C) Likewise, the term bear can be applied to a person who expects stock prices to fall and sells stock that he or she does not have for delivery at a future date.
(D) It is a designation commonly used in securities markets and commodity markets and is the opposite of a bull market.
In each of these questions, a part of the sentence has been underlined. Find the best way of writing the underlined part of the sentence.
To prepare himself, he subjected himself to two weeks of total abstinence and intensive training in the open fields of Panipat, climbing the hills nearby 30 times, spend nights in the open and to test to see how long he could hold out without food.
In rural India, many mango trees are planted at the end of a village or at the border of a district, for providing excellent shade during summer, and shelter during winter.
Mental intelligence and common sense are essential for outstanding achievement because they involve your natural ability to comprehend difficult concepts quicker and to analyse them clearly and incisively.
Panchayati Raj institutions are now entrusted upon the execution of all rural upliftment schemes and programs in India.
Each question has a given sentence. Identify the best way of writing the sentence in the context of the correct usage of standard written English. While doing so, ensure that the message being conveyed remains the same in all the cases.
Having bowed our heads, the priest in the temple led us in prayer.
Anyone interested in flying planes can learn much if you have access to a flight simulation machine.
The moral of the entire story is how money doesn’t make you happy.
Solution
The best option is "The moral of the entire story is that money doesn’t make you happy."
This option is grammatically correct and clearly expresses the message. It uses "that" to introduce the moral, which is the proper way to state it. The other options are either awkward or less clear.
Ever since the sting operation, there has been much opposition from they who maintain that it was an unauthorised act.
Identify incorrect sentence.
For the following questions answer them individually
The angles of elevation of the top of a tower, from the top and the foot of a pole of height 10 m, are 30° and 60° respectively. The height of the tower is
Solution
Let the height of tower be h metres.
tan 30 = 1/root3 = (h-10)/base
base = (h-10) *root3
tan 60 = h/base
base = h/root3
So, (h-10) *root3 = h/root3
3h - 30 = h
h = 15 metres, therefore, height of tower is 15 metres.
A person standing on the bank of a river finds that the angle of elevation of the top of a tower on the opposite bank is 45°. Then which of the following statements is correct?
Solution
tan angle = perpendicular/base
So, in right angled triangle,
tan 45 = height of tower/breadth of river
Since tan 45 = 1
So, height of tower = breadth of river
Hence B
A person standing on the bank of a river observes that the angle of elevation of the top of a tree on the opposite bank of the river is 60° and when he walks 40 metres away from the tree the angle of elevation becomes 30°. The breadth of the river is
Solution
Let the height of tower be h m.
Let x be the distance from the bottom of tower to the point where it makes 60 degrees angle [also breadth of the river]
Applying in right triangle:
tan 60 = h/x
x = h/root3
and
tan 30 = h/x+40
Putting value of x in above equation, we get
h = 20 root3
and x = 20 metres
So, breadth of the river = 20 metres.
A class consists of 100 students; 25 of them are girls and 75 boys; 20 of them are rich and the remaining poor; 40 of them are fair-complexioned. The probability of selecting a faircomplexioned rich girl is
Solution
Given:
Total students = 100
Girls = 25 , Boys = 75
Rich = 20 Poor = 80
Fair complexion = 40, Dark = 60
Probability of selecting:
a girl = 25/100 = 1/4
a rich person = 20/100 = 1/5
a fair person = 40/100 = 2/5
So, Probability of selecting a faircomplexioned rich girl is = 1/4*1*5*2/5 = 0.02
A box contains 5 brown and 4 white socks. A man takes out two socks. The probability that they are of the same colour is
Solution
He can pick brown brown Or
brown blue Or
blue blue Or
blue brown
Only the first and third choices are what we want
Brown is 5/9 then 4/8 as it is not replaced
Blue is 4/9 then 3/8 same reason
So P(2 brown)=5/9×4/8=20/72
P(2 blue)=4/9×3/8=12/72
P(2 same)=20/72+12/72=32/72=4/9
India plays two matches each with West Indies and Australia.In any match the probabilities of India getting points 0, 1 and 2 are 0.45, 0.05 and 0.50 respectively. Assuming that the outcomes are independent, the probability of India getting at least 7 points is
Solution
Total matches played = 4
Maximum points = 2 * 4 = 8
So to get atleast 7 points , India needs to win atleast 3 matches and one can be draw.
1. India wins all 4 matches: There is only one possible outcome
Hence, the probability of 4 wins = (0.5)*(0.5)*(0.5)*(0.5) = 0.0625
2. India wins 3 matches and draws 1: probability in that case = (0.5)*(0.5)*(0.5)*(0.05) = 0.00625
(since 4 cases, any one match an be draw)
P = 0.0625 + 0.025 = 0.0875
Out of 13 applications for a job, there are 5 women and 8 men. It is desired to select 2 persons for the job. The probability that at least one of the selected persons will be a woman is
Solution
Let there be no women,only man so:
Probability = 8C2/13C2
= 14/39
So, Probability of at least 1 women = 1-14/39
= 25/39
Hence C
At a college entrance examination each candidate is admitted or rejected according to whether he has passed or failed the tests. Of the candidates who are really capable, 80% pass the tests and of the incapable, 25% pass the tests. Given that 40% of the candidates are really capable, then the proportion of capable college students who passed is about
Solution
Let the total candidates = t and capable candidates be x and incapable be y.
Passing the tests = 0.8x + 0.25y
Fail the test = 0.2x + 0.75y
Given x = 40/100*t and y = 0.6t
Pass = 0.8*0.4t + 0.25*0.6t = 0.32t + 0.15t = 0.47t
Proportion of capable college students who passed is = 32/47 = 68%
In an examination, there were 2000 candidates, out of which 900 candidates were boys and the rest were girls. 1f 32% of the boys and 38% of the girls passed, then the total percentage of failed candidates is
Solution
boys = 900
girls = 1100
Passed = 32% of 900 + 38% of 1100 = 288 + 418 = 706
Failed = 2000 - 706 = 1294
Total % of failed candidates = (2000 - 706) / 2000 = 1294/2000 = 64.7%
From the salary of an officer, 10% is deducted as house rent, 15% of the rest he spends on children’s education and 10% of the balance he spends on clothes. After this expenditure he is left with Rs 1377. His salary is
Solution
Let the salary be s.
Home rent = s/10
Education = 15% of 9s/10 = 135s/1000
Balance = s - (s/10 + 135s/1000) = s - 235s/1000 = 765s/1000
Clorhes = 765s/10000
Left salary = 765s/1000 * 9/10 = 6885/10000 s
Given : 6885s /10000 = 1377
s = 2000
If the price of gold increases by 30%, find by how much the quantity of ornaments must be reduced so that the expenditure may remain the same as before.
Solution
The price of gold increases by 30%
let the initial price be x
let the initial consumption by y
since the price of gold increases by 30 %
final price of gold =1.3x
now, expenditure=price*consumption
let the final consumption be z
given total expenditure remains constant
Therefore
x*y=1.3 x *z
Therefore z=(y/1.3)
% decrease=((initial consumption-final consumption)/initial consumption)*100%
Therefore,
% decrease=((y-z)/y)*100%=(1-(1/1.3))*100%=(1-0.769)*100%=
= 23 1/13%
A monthly return railway ticket costs 25 per cent more than a single ticket. A week’s extension can be had for the former by paying 5 per cent of the monthly ticket’s cost. If the money paid for the monthly ticket (with extension) is Rs 84, the price of the single ticket is
Solution
Let x be the price of single ticket
Return railway ticket = 125x/100
5% of return ticket = 5/100 * 125x/100 = 25x/400 = x/16
Given : 125x/100 + x/16 = 84
Solving for x, we get
x=64
A papaya tree was planted 2 years ago. It increases at the rate of 20% every year. If at present, the height of the tree is 540 cm, what was its height when the tree was planted?
Solution
Let the height at time of plantation be h.
now, height = 540 = 6/5*6/5*h
36/25h = 540
h = 540*25/36 = 375 cm
A mixture of 40 litres of milk and water contains 10% water. How much water should be added to this so that water may be 20% in the new mixture?
Solution
In mixture: 40 l
Milk = 36 l
Water = 4 l
Let x amount of water be added, so
4 + x = 20/100 (40 + x)
Solving for x, we get
x = 5 litres
The amount of water (in ml) that should be added to reduce 9 ml lotion, containing 50% alcohol, to a lotion containing 30% alcohol, is
Solution
Lotion = 9 ml
Alcohol = 4.5 ml
water = 4.5 ml
Let water be added is x ml
so, x + 4.5 = 70% of (9 + x) [since alcohol is 30%, so water is (100-30) = 70%]
x = 6 ml
The average of marks obtained by 120 candidates was 35. If the average of the passed candidates was 39 and that of the failed candidates was 15, then the number of those candidates who passed the examination, was
Solution
T = total students, P =passed, F = failed students
AVERAGE = SUM OF MARKS OF ALL STUDENTS/ NUMBER OF STUDENTS
A = 35 = ΣT/120
ΣT = ΣF + ΣP = 120*35 = 4200 ---(1)
and ΣP = 39*P, ΣF = 15*F [F = 120-P]
Putting values of ΣP and ΣF in equation 1, we get
4200 = 15(120-P) + 39P
4200 = 1800 - 15P + 39P
24P = 2400
P = 100 (passed students)
Angad was conducting an experiment in which the average of 11 observations came to be 90, while the average of first five observations was 87, and that of the last five was 84. What is the measure of the 6th observation?
Solution
Let the sum of first 5 numbers be x and last five be yand 6th observation be t.
So, by averages formula, we get
x + t+ y = 11*90 = 990 ...-(1)
x = 87*5 = 435
y = 84*5 = 420
So, putting values in equation 1, we get
435 + t + 420 = 990
t = 135
The average age of an adult class is 40 years. 12 new students with an average age of 32 years join the class, thereby decreasing the average by 4 years. The original strength of the class was
Solution
Le the number of students originally in a class be n.
By averages concept,
ΣN = 40n
Σnew = 32*12 = 384
new average = 36
ΣN + Σnew = 36(n+12)
40n + 384 = 36n + 432
4n = 48
n = 12
The average age of 8 persons in a committee is increased by 2 years when two men aged 35 years and 45 years are substituted by two women. The average age of these two women is
Solution
Let the average age of members of committee be A and 2 women be a and b.
ΣM = A * 8
ΣM +a + b - 35 - 45 = 8*(A + 2)
8A + a + b - 35 - 45 = 8*(A + 2)
a+b = 96
Average age of 2 women = 96/2 = 48 years
At Narmada Sarovar bachao (NSB) demonstration, supporters of Ms Patkar outnumbered the police by 9 : 1. The police arrested 135 NSB supporters averaging 5 for every 3 policemen. How many supporters of NSB were there in the demonstration?
Solution
The number of police involved in the security operation
= 3/5×135
=3×27
= 81
Thus, the required number of supporters = 81×981×9
= 729
The ratio between the number of passengers travelling by I and II class between the two railway stations is 1 : 50, whereas the ratio of I and II class fares between the same stations is 3 : 1. If on a particular day, Rs 1325 revenue collected from the passengers travelling between these stations, then what was the amount collected from the II class passengers?
Solution
Passenger :
I = x
II = 50x
Fares;
I = 3y
Ii = y
3yx + 50xy = 1325
53xy = 1325
xy = 25
Amount collected from the II class passengers = 50xy = 50 *25 = 1250
A and b enter into a partnership with Rs. 50,000 and Rs.60,000 respectively. C joins them after x months contributing Rs 70,000 and b leaves x months before the end of the year. If they share the profit in the ratio of 20 : 18: 21, then find the value of x.
Solution
Profit is divided in the ratio of investment:
A = 50000*12 = 600000
B = 60000(12-x)
C = 70000x
The ratio is 20:18:21
To get the above ratio. x = 3
Rahul started a business with a capital of Rs 8,000. After six months, Sanjay joined him with an investment of some capital. If at the end of the year each of them gets equal amount as profit, how much did Sanjay invest in the business?
Solution
Let the investment made by Sanjay be x rs.
Rahul capital * Number of months invested = Sanjay capital * Number of months invested
8000*12 = x*6 (since Sanjay joined after 6 months)
x= Rs. 16000
A manufacturer of a certain item can sell all he can produce at the selling price of Rs 60 each. It costs him Rs 40 in materials and labour to produce each item and he has overhead expenses of Rs 3000 per week in order to operate that plant. The number of units he should produce and sell in order to make a profit of at least Rs 1000 per week is
Solution
Le the items produced be y.
Then, Cost Price = [40y + 300]
Selling price = 60y
Profit = 1000 = 60y - (40y + 300)
y = 200
If the selling price of a product is increased by Rs 162, then the business would make a profit of 17% instead of a loss of 19%. What is the cost price of the product?
Solution
Let the Selling price be s rupees. CP = cost price
Earlier:
Loss = 19% = CP - SP/CP = 1-S/C
S = 81C/100
Now:
Profit = 17%
So. new SP = 117C/100
S + 162 = 117/100 * C
81C /100 + 162 = 117 C/100
C = Rs. 450
So, cost price is Rs. 450.
Two men undertake to do a piece of work for Rs. 1,400. First man alone can do this work in 7 days while the second man alone can do this work in 8 days. If they working together complete this work in 3 days with the help of a boy, how should money be divided?
Solution
Money is divides in the ratio of amount of work done or in inverse ratio of number of days taken to do the work.
So, let boy take b days to complete work.
1/7 + 1/8 + 1/b = 1/3
1/b = 11/168
b = 168/11
Ratio of days = 7:8:168/11
Amount of Rs. 1400 is divided in inverse ratio:1/7:1/8:11/168 = 24:21:11
So the amount would be 600 , 525, 275 rupees.
Two men undertake to do a piece of work for Rs 600. One alone could do it in 6 days and the other in 8 days. With the assistance of a boy they finish it in 3 days. boy’s share should be
Solution
Let the boy take b days to complete the work
So,
1/6 + 1/8 + 1/b = 1/3
1/b = 1/24
b = 24 days
Amount divided in inverse ratio of number of days taken, so
Days ratio = 6:8:24
Inverse ratio of amount divison = 1/6:1/8:/24 = 4:3:1
Boy's share = 1/8 * 600 = Rs. 75
15 men can complete a work in 210 days. They started the work but at the end of 10 days, 15 additional men, with double efficiency, were inducted. How many days, in whole, did they take to finish the work?
Solution
Total man days = 210* 15 = 3150
Man days:
for 1st 10 days = 10 * 15 = 150
Let now days taken be d after induction of 15 men.{double efficency means 1 men can be counted twice, so 30 men0
Total men now = 15 + 15*2 = 45 men
45d + 150 = 3150
d = 200/3
Total days = 200/3 + 10 = 230/3 = $$76\frac{2}{3}$$ days
There are two taps to fill a tank while a third to empty it. When the third tap is closed, they can fill the tank in 10 minutes and 12 minutes, respectively. If all the three taps be opened, the tank is filled in 15 minutes. If the first two taps are closed, in what time can the third tap empty the tank when it is full?
Solution
Let the capacity of tank be 180 litres.
1st tap fill 180 litres in 10 minutes, 1min= 18 lt fill
2nd tap fill 180 litres in 12 minutes, 1min= 15 lt fill
3rd tap empty 180 litres in x minutes [let]... 1 min empty = 180/x lt
Total filling time = 15 minutes
15*18 + 15*15 - 15*180/x = 180
270 + 225 - 2700/x = 180
2700/x = 315
x = 2700/315
x = 8 min and 34 secs
A cistern has two taps which fill it in 12 minutes and 15 minutes respectively. There is also a waste pipe in the cistern. When all the pipes are opened, the empty cistern is full in 20 minutes. How long will the waste pipe take to empty a full cistern?
Solution
Let the capacity of tank be 180 litres.
1st tap fill 180 litres in 15 minutes, 1min= 12 lt fill
2nd tap fill 180 litres in 12 minutes, 1min= 15 lt fill
3rd tap empty 180 litres in x minutes [let]... 1 min empty = 180/x lt
Total filling time = 20 minutes
20*12 + 20*15 - 20*180/x = 180
Solving for x, x = 10 minutes
Two taps can fill a tank in 20 minutes and 30 minutes respectively. There is an outlet tap at exactly half level of that rectangular tank which can pump out 50 litres of water per minute. If the outlet tap is open, then it takes 24 minutes to fill an empty tank. What is the volume of the tank?
Solution
Let the volume of the tank be v litres.
Pipe 1 : 1 min = v/20 lt fill
Pipe 2 : 1 min = v/30 lt fill
Pipe 3: 1 min = v/50 lt empty
Both inlet pipes can together fill the tank in 20*30/20+30 = 600/50 = 12 minutes, half a tank in 6 minutes.
So, for 6 minutes, both inlet pipe work and for (24-6) = 18 minutes both inlet and one outlet pipes work.
1/2 {6v/20 + 6v/30} +1/2{ 18v/20 + 18v/30 -18v/ 50} = v
v = 1800 litres
Excluding stoppages, the speed of a bus is 54 km/hr and including stoppages, it is 45 km/hr. For how many minutes does the bus stop per hour?
Solution
Time taken including stoppages be t and without stoppages be x.
d = 54 *x
d = 45*t
54x = 45t
x/t = 5/6
Let t be 1 hr = 60 minutes, x = 50 minutes (from above equation)
So, stoppage per hour = 10 minutes.
Rampur is 100 km from Sitapur. At 3 pm bharat Express leaves Rampur for Sitapur and travels at a constant speed of 30 km/h. One hour later, Laxman Mail leaves Sitapur for Rampur and travels at a constant speed of 40 kmph’. Each train makes one stop only at a station 10 km from its starting point and remains there for 15 min.Which train is nearer to Rampur when they meet?
Solution
Bharat express:
3:00- start from Rampur
3:20 reach stoppage
3:35 start for Sitapur
4:30 30*55/60 = 330/12 = 27.5 km travel since 3:35
Total travel till 4:30 = 27.5 + 30/3 = 37.5 km
Laxman Mail:
4:00 at Sitapur
4:15 reach stopage
4:30 start for Rampur
Total travel till 4:30 = 10 kms
Time after two trains meet = distance between them/Relative speed
t = 90-37.5/70 = 0.75 hrs = 45 min
5:15 meeting of 2 trains
At 5:15.
Bharat express from Rampur = 37.5 + 45/60 * 30 = 60 kms
Laxman Mail from Rampur = 100 - {10+45/60 * 40} = 100 - 40 = 60 kms
So both trains are equidistant from Rampur.
A car starts running with the initial speed of 40 kmph, with its speed increasing every hour by 5 kmph. How many hours will it take to cover a distance of 385 km?
Solution
There is an Arithmetic Progression here,
40 + (40+5)+ (40+5+5) .....n terms = 385
So, sum of terms = 385
first term = 40 and common difference = 5
S = n/2[2a + (n-1)*d]
385 = n/2[80+5n-5)
770 = n[75+5n]
154 = n(15+n)
n = 7
So it takes 7 hours to cover a distance of 385 kms.
How many kg of tea worth Rs 25 per kg must be blended with 30 kg of tea worth Rs 30 per kg so that by selling the blended variety at Rs 30 per kg there should be a gain of 10%?
Solution
Cost price of the mixture $$\times$$ (100 + Gain)% = Selling price of the mixture
Cost price of the mixture $$\times$$ (100 + 10)% = 30
Cost price of the mixture $$\times$$ 110% = 30
Cost price of the mixture = $$\frac{30}{1.10}$$ = Rs. 27.27
By the rule of mixture and Alligation,
Let the quantity of tea = x
Type A Type B
x 30
25 30
27.27
2.73 2.27
$$\frac{x}{2.73}$$ = $$\frac{30}{2.27}$$
x = $$\frac{30\times2.73}{2.27}=36 kg$$
How many kg of sugar costing Rs 5.75 per kg should be mixed with 75 kg of cheaper sugar costing Rs 4.50 per kg so that the mixture is worth Rs 5.50 per kg ?
Solution
Let the quantity of sugar = x
By the rule of mixture and Alligation,
Type A Type B
x 75
5.75 4.50
5.50
1.00 0.25
$$\frac{x}{1.00}$$ = $$\frac{75}{0.25}$$
x = $$\frac{75 \times 1}{0.25}$$
x = 300 Kg
The average monthly salary of employees, consisting of officers and workers of an organisation is Rs 3000. The average salary of an officer is Rs 10,000 while that of a worker is Rs 2,000 per month. If there are total 400 employees in the organisation, find the number of officers and workers separately.
Solution
Let the number of officers be x.
And number of workers be = (400 - x).
3000$$ \times $$400 = 10,000$$ \times $$x + 2000$$ \times $$(400 - x)
1200000 = 10000x + 800000 - 2000x
1200000 - 800000 = 8000x
400000 = 8000x
x = $$\frac{400000}{8000}$$
x = 50
Number of officers = 50
Number of workers = 400 - 50 = 350
A person travels 285 km in 6 hrs in two stages. In the first part of the journey, he travels by bus at the speed of 40 km per hr. In the second part of the journey, he travels by train at the speed of 55 km per hr. How much distance did he travel by train?
Solution
Let the person travel be train = x hours
Person travel by bus = (6 - x)
The distance traveled by train = 55$$ \times $$x
The distance traveled by bus = 40$$ \times $$(6 - x)
40 (6 - x) + 55x = 285
240 - 40x + 55x = 285
15x = 285 - 240
15x = 45
x = $$\frac{45}{15}$$
x = 3 hours
Distance traveled by train = 55 $$ \times $$ 3 = 165 Km.
How many kg of pure salt must be added to 30 kg of a 2% solution of salt and water to increase it to a 10% solution?
Solution
Amount of salt in 30kg solution = $$\frac{2 \times 30} {100}$$ = 0.6 kg
Let x kg of pure salt is added:
Then, $$\frac{0.6 + x} {30 + x}$$ = $$\frac{10} {100}$$
60 + 100x = 300 + 10x
100x - 10x = 300 - 60
90x = 240
x = $$\frac{240} {90}$$
x = $$\frac{8} {3}$$
x = 2$$\frac{2} {3}$$ kg
Two persons are walking in the same direction at rates 3 km/hr and 6 km/hr. A train comes running from behind and passes them in 9 and 10 seconds. The speed of the train is
Solution
Let the speed of train = S km/hr
Let the length of train = x meters
When a train crosses a man, it travels its own distance.
According to question,
Distance = Speed$$ \times $$Time
x = (S - 3)$$ \times \frac{5}{18} \times 9$$ (1)
Also,
x = (S - 6)$$ \times \frac{5}{18} \times 10$$ (2)
From equation (1) and (2)
(S - 3)$$ \times \frac{5}{18} \times 9$$ = (S - 6)$$ \times \frac{5}{18} \times 10$$
(S - 3)$$ \times $$9 = (S - 6)$$ \times $$10
9S - 27 = 10S - 60
10S - 9S = 60 - 27
S = 33 km/hr
Each of the Question ns below is followed by two statements, labelled (A) and (B). Decide whether the data given in the statements is sufficient for answering the question.
Mark answer as
How much did the salesman earn from the sale of 3 cars?
(A) Each car sold for Rs 3,40,000
(B) He received a 2% commission on each sale.
Solution
Clearly, each statement alone is insufficient because we do not know salesman commission from first statement and sale of cars from second.
Combining both statements, we get salesman commission = $$3\times\frac{2}{100}\times3,40,000$$
= Rs. $$20,400$$
Thus, both statements are required.
=> Ans - (A)
What does WXY equal?
(A) W=X+Y
(B) WXYZ = 6Z
Solution
First statement alone is insufficient as W, X and Y can be any integer possible.
Statement B : WXYZ = 6Z
=> WXY = 6
Thus, statement B alone is possible to answer the question.
=> Ans - (B)
Which number is greatest C, D or E?
(A) 2D > 2E > 2C
(B) C + 2 = D > E
If Sanjay can paint a house in 15 hours working alone, how long will it take to paint the house if Mohit helps him?
(A) Mohit can paint the house in 20 hours working alone.
(B) Working together with Sanjay, Mohit does 3/7 of the total work.
Solution
A) If Mohit takes 20 hours,
Both of them took = 15*20 / 15+20 = 300/35 hours
So, this statement is enough to answer the question.
B) Since number of hours is inversely proportional to amount of work done.
So, Since Sanjay's working hours is given and Mohit's amount of work is given, we can find out the no. of hours taken by Mohit.
Work ratio of Sanjay and Mohit = 4:3
No. of hours required ratio = 15:x
So, inverse ratio
4/3 = x/15
x = 20
Hence, we can find number of hours taken by Mohit from individual sentences.
In each of these Question two quantities are given, one in column A and one in column B.
Compare the two quantities.
Given Information
x = -2
Column A
$$3x^2 + 2x - 1$$
Column B
$$x^3 + 2x^2 + 1$$
Solution
x = -2
Column A:
$$3x^2 + 2x - 1$$
$$3*(-2)^2 + 2(-2) -1$$
$$12-4-1$$
$$7$$
Column B:
$$x^3 + 2x^2 + 1$$
$$(-2)^3 + 2(-2)^2 +1$$
$$-8+8+1$$
$$1$$
So, Quantity A > Quantity B
Given Information
$$\frac{a}{a + b} = \frac{c}{c + d}$$
Column A
cb
Column B
ad
Solution
$$\frac{a}{a + b} = \frac{c}{c + d}$$
On solving, we get by cross multiplying,
ac + ad = ac + bc
ad = bc
Hence Column A = Column B
Given Information
An audio cassette priced at Rs 47.25 includes a 5% mark-up mark-up
Column A
Rs.44.89 price before mark-up
Column B
The original
Solution
Column A:
Price before markup be x (let)
So, price after markup of 5% = Rs. 47.25
x*1.05 = 47.25
x = Rs. 45
So Quantity B > Quantity A
Given Information
25% of the 300 girls in our school wear spectacles do not
Column A
The ratio of girls wearing to those who do not.
Column B
1 : 3
Solution
Column A:
Number of girls = 300
No. of girls wearing spectacles = 25% of 300 = 75
No. of girls not wearing spectacles = 25% of 300 = 225
Ratio = 75:225 =1:3
Hence Quantity A = Quantity B
Refer to tint following line graph which represents the rainfall in inches during the months of January through July in a particular year in a certain city.

In each of those Question ns two quantities are given, one in column A and one in column b. Compare the two quantities.
Column A
The ratio of rainfall between the months February and July
Column B
2 : 3
Solution
Column A :
Rainfall in the month February = 1.4
Rainfall in month July = 2
Ratio = 1.4:2
= 0.7:1
Column B:
2:3 = 0.67
So, Quantity A > Quantity B
Column A
The average monthly rainfall recorded for the 7 months
Column B
1.9 inches
Solution
Column A:
The average monthly rainfall recorded for the 7 months is
0.4+1.4+2.2+2.8+2.4+1.4+2 = 12.6
Average = 12.6/7 = 1.8
Column B :
1.9
So, Quantity B > Quantity A
Column A
12½% of all the rain that fell during the 7 month period
Column B
The amount of rainfall during Rainfall during the month of February.
Solution
Column A:
Total rain fell in 7 months = 126
25/2% of 12.6 = 1.575
Column B:
Rainfall in month of Feb = 1.4
So, Quantity A > Quantity B
Column A
The ratio between average rainfall in average rainfall in May and January
Column B
The ratio between the average rainfall in April and February
Solution
Column A
The ratio between average rainfall in average rainfall in May and January =
1.4 + 2.4/2 = 1.9
Column B
The ratio between the average rainfall in April and February =
1.4+2.8/2 = 2.1
So, Quantity B > Quantity A
Study the table to answer these questions.
Table - Number of cancer cases over two years for selected countries.

All countries that have reported more than five hundred cancer to the WHO in 2007 are listed here. The left column gives the total number of cases reported by each country for 2006, the middle column gives the 2006 rate (cancer cases per 10,000 population) and the last column shows the number of cases reported in early 2007.
Most of the 2007 reports were for only the first quarter of the year. Owing to reporting delays of six months or more, cases reported in 2007 actually were diagnosed in 2006.
What is the population of AD on the basis of the reported cases of cancer in 2006 (in thousands)?
Solution
Reported cases in 2006 = 7100
Rate of cases reported in 2006 = 0.8
Population of AD on the basis of the reported cases of cancer in 2006 (in thousands) = 7100/0.8
= 875000
Which country has reported the second highest number of cancer cases to WHO during 2006?
Solution
Number of cases reported in 2006:
From top to bottom:
AG = 21,861
N = 1862
F = 1365
U = 896
So, N has second highest number of cases reported in 2006.
The countries which have reported less than 2000 cases both the 2006 and early 2007 are
Solution
Option A:
J and P have cases higher than 2000.
Option B:
A and J have higher than 2000.
Option C:
M has higher.
Option D:
All have cases lower than 2000.
Which of the following are true from the table?
I. The reported cancer cases of M, Wand AJ as compare to their population are negligible.
II. The 2006 rate is highest for P though the reported cases are only 4700.
III. The population of R is 664,000 in 2006.
IV. P reported more than 20,000 cases of cancer in early 2007
Solution
1) The reported cancer cases of M, Wand AJ as compare to their population are negligible as it is 0.
2) The 2006 rate is highest for P though the reported cases are only 4700. True from the table.
3) Population of R = 337/5 *10000 = 674000
4) P reported only 11 cases.
So, option C is correct.
Refer to the following Tables (A) and (B) to answer these questions.
Table A: Production of Inorganic Chemicals

Table B: Production of Organic Chemicals

The ratio of the number of organic chemicals for which the production has fallen to the number of inorganic chemicals for which production has fallen is
Solution
Organic chemicals for which the production has fallen =
Aniline
Acetone
Anhydride
Phenol
Inorganic chemicals for which the production has fallen =
Bleaching Powder
Alum. Chloride
Phosphate
Calcium carbonate
Calcium carbide
oxide
So, the ratio = 4:6
= 2:3
Of all chemicals shown, the highest percentage increase in production has been exhibited for
Solution
First we have to see, for which quantities production has increased.
Highest percentage increase in production = [Production - Previous Production]/Previous Production
% increase = 72895 - 61615 / 61615
%increase = 11280/61615 * 100
% increase = 18.30%
The chemical, whose production in 2003 - 04 as a proportion of its total production for the two-year period was the lowest, is
Solution
Production in 2003 - 04 as a proportion of its total production for the two-year period:
By observing from the tables, we get
Titanium oxide :
Production in 2002 = 30422
Production in 2003 = 19624
Proportion = 19624/(30422+19624)
Proportion = 19624/50046
Proportion = 39.21%
If productive volatility is defined as the percentage change in production, and it is known that any chemical whose productive volatility is greater than 5% is classified as highly volatile, then how many chemicals are not highly volatile (amongst organic chemicals)
Solution
Organic chemicals:
Glycol = 327387*1.05 < Production in 2003, so highly volatile
Formaldehyde = 140384*1.05>Production in 2003, so not volatile
Fatty Acids = 99320*1.05<Production in 2003, so highly volatile
Aniline = decrease in production
Acetone =decrease in production
Acetic acid= 208921*1.05 < Production in 2003, so highly volatile
Anhydride = decrease in production
Benzene= 329000*1.05<Production in 2003, so highly volatile
Phenol = decrease in production
So, total value is 5.
Consider the following graph where the prices of timber are given, for the period 1997- 2003. The prices for plywood and sawn timber are given in Rs. 1 ton while the price of logs is given in Rs per cubic meter. Assume 1 ton is equal to 1,000 kg and one cubic meter of Log weighs 800 kg.
Timber Product Prices
prices

years
Which product had the largest percentage increase in price per cubic meter over the 7-year period?
The maximum increase in price per cubic metre for any product over any two successive years was
In 2003, the total sales of the company measured in cubic metres was made up of 40% plywood, 30% sawn timber and 30% logs. The average realisation per cubic metre in 2003 was closest to
In 2004, the prices of plywood, sawn timber and logs went up by 5%, 1% and 10%, respectively, and the total sales were made up of 40% plywood, 30% sawn timber and 30% logs. The average realisation per cubic metre in 2004 was closest to
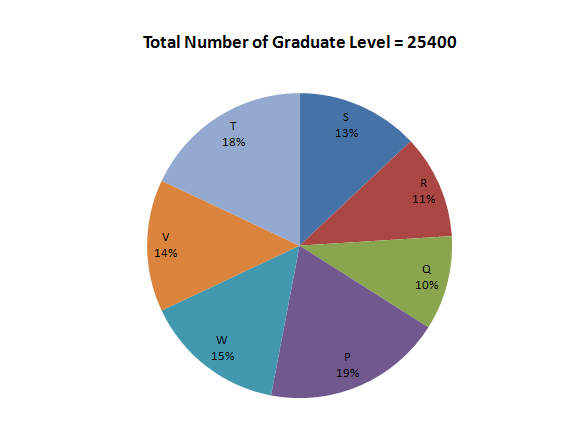
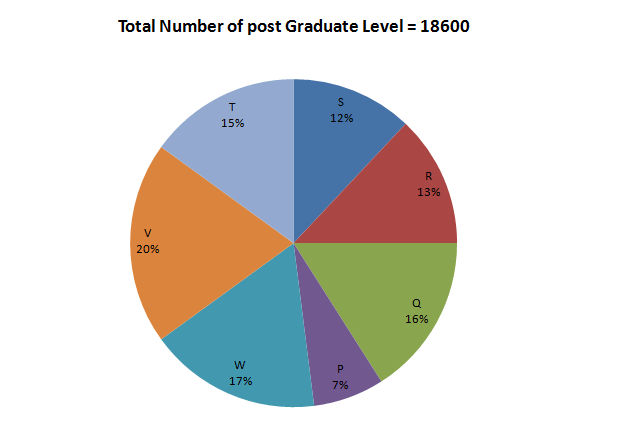
Directions: The following pie-charts show the distribution of students of graduate and post-graduate levels in seven different institutes namely P, Q, R, S, T, V, and W.
According to these graphs, approximately, how much money from the investment portfolio was invested in high-risk stocks?
Approximately how much money belonging to the investment portfolio was invested in State-issued bonds?
Which of the following earned the least amount of money for the investment portfolio?
Which of the following was the greatest?
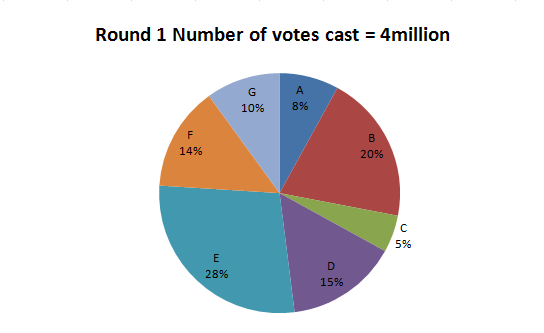
Directions: Study the graphs to answer this question. In an election, if no single candidate secures a simple majority of 50% in the first round, then the top five candidates in terms of votes polled proceed to the next round. If no one still gets a simple majority, then the top three of that round go into the next round. If the decision is still not decisive in favor of one candidate, only the top two proceed to the last round. The following pie charts show the results of the elections.
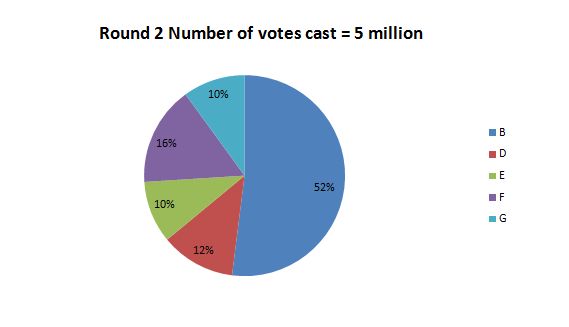
Which of the five states has the highest percentage of readers of Hindi newspapers?
From the data provided above we can infer that
If UP has 25,00,000 newspaper readers and Rajasthan has 15,00,000, how many more readers buy English newspapers in UP than in Rajasthan (approximately)?
About what percentage of readers in Rajasthan read Urdu newspapers?
Study the following pie chart in respect of a library to answer these questions.

What was the percentage increase in the number of employees of the company from 1995-96 to 1997 -98?
What was the average number of employees who worked in the company over the given years?
What was the difference between the average of the total salaries paid by the company over the given years and the total salary paid by the company in the year 1997 -98?
The total expenditure of the company in 1995-96 was approximately what per cent of the average of the total expenditures of the company over the given years?
Study the following pie-charts carefully to answer these questions.
Percentage of Students in a College, Studying Various Subjects and the Percentage of Girls out of these
Total students: 1800 (1200 girls + 600 boys) Percentage of students in various subjects

Total Girls : 1200
Percentage of students in various subjects

The number of girls studying art in college is
For which subject is the number of boys the minimum?
Solution
From the given pie charts, the values can be calculated as,
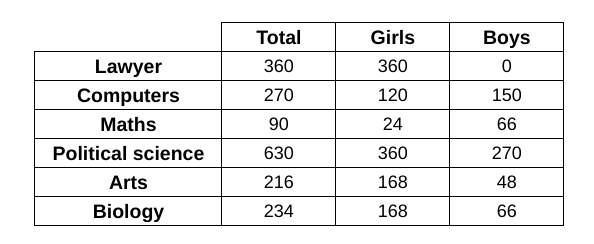
Clearly, we can see that the subject in which the boys are minimum is Law as there are 0 boys in it.
Hence, the correct answer is option A.
For Political Science, what is the respective ratio of boys and girls?
Solution
We know total girls = 1200, total boys = 600
From the first pie chart, we know it is given for girls and boys combined.
Out of 1800 girls and boys, 35% of the girls are studying political science.
That is, number of total students studying political science = 35% of 1800 = 630
Also, from the second pie chart, we know it is given for girls.
Out of 1200 girls, 30% of the girls are studying political science.
That is, number of girls studying political science = 30% of 1200 = 360
Thus, boys studying political science = 630-360 = 270.
Therefore, the ratio of boys and girls studying political science = 270:360 = 3:4
The number of girls studying art is what per cent more than the number of boys studying art?
Answer the Questions independently of each other.
In a certain code ROAD is written as URDG. How is SWAN written in that code?
Which of the following will come in place of the Question n mark(?) in the following sequence? 6C7,8F10, 11J14, 15O19,?
Ram walks 10m South from his house, turns left and walks 23m, again turns left and walks 40 m, then turns right and walks 5 m to reach his school. In which direction is the school from his house?
If table is called chair, chair is called cot, cot is called pot and pot is called filter, where does a person sit?
Off-hand is related to PERFUNCTORY, in the same way as above, board is related to
In a class of 35 students, Kiran is placed $$7^{th}$$ from the bottom whereas Mohan is placed $$9^{th}$$ from the top. Sohan is placed exactly in between Kiran and Mohan. What is Kiran’s position from Sohan?
If the second, third, fifth, eighth and ninth letters of the word CONTEMPLATION are combined to form a meaningful word, what will be the middle letter of the word? If more than one such word can be formed, your answer is X and if no such words can be formed your answer is Y.
Pointing to a photograph Arun said, ‘She is the mother of my brother’s son’s wife’s daughter.’ How is Arun related to the lady?
Which one is different from the remaining three?
AbCD is related to OPQR in the same way as WXYZ is related to
The letters skipped between adjacent letters are the order of 1,2,3,4 .............. Which alternative follows this rule?
Solution
Between D and F there is one letter skipped, between F and I, two letters are skipped,between I and M three letters are skipped, between M and R there are 4 letters skipped.
Hence DFIMR is the correct order
A boy goes to see a film and finds a man who is his relative. The man is the husband of the sister of his mother. How is the man related to the boy?
I am facing west. I turn 45° in the clockwise direction and then 180° in the same direction and then 270° anticlockwise. Which direction am I facing now?
In a month of 31 days, the third Wednesday falls on the 15th. What will be the last day of that month?
When Ranjeev was born, his father was 32 years older than his brother and his mother was 25 years older than his sister. If Ranjeev’s brother is 6 years older than Ranjeev and his mother is 3 years younger than his father, how old was Ranjeev’s sister when he was born?
In a party everyone gave a gift to everyone else. If the total number of gifts exchanged in the party was 600, how many persons were there in the party?
Solution
let's assume there are n persons at the party.
Since everyone gives a gift to everyone else, the number of gifts exchanged is the number of pairs of people.
Each person gives a gift to n-1 other people, so the total number of gifts exchanged is:
So, total gifts: n * (n-1)
We know:
n * (n-1) = 600
Now, using options, we see that n = 25 satisfies the condition.
Hence, there were 25 people at the party.
After a get-together every person present shakes the hand of every other person. If there were 105 handshakes in all, how many persons were present in the party?
Solution
The total number of handshakes between two people, such that each person shakes with another person, is $$^nC_2$$.
Let us assume the total number of persons present at the party is = n
Thus, we know the value of $$^nC_2$$ = 105
$$^nC_2=\frac{n!}{\left(n-2\right)!2!}$$
=> $$\frac{n\left(n-1\right)}{2}=105$$
n(n-1) = 210
Thus, the value of n = 15
As, 15*14 = 210
Four friends were playing a game of cards sitting in a circle. Shankar was on the right of Ram and Gopal was on the left of Arvind. Which of the following pairs were partners?
Four girls (G1, G2, G3, G4) and three boys (b1, b2, b3) are to sit for a dinner such that no two boys should sit together nor two girls. If they are successively sitting, what is the position of b2 and G3?
There are 30 plants of Chiku, Guava, Sitafal and Mango in a row. There is one pair of Mango plants after Chiku and Guava and Mango plants are followed by one Chiku and one Sitafal plant and so on. If the row begins with a plant of Chiku, then which of the following will be the last in the row?
Study the following information to answer these Questions.
A blacksmith has five iron articles A, B, C, D and E, each having a different weight.
(i) A weighs twice as much as B.
(ii) B weighs four and- a-half times as much as C.
(iii) C weighs half as much as D.
(iv) D weighs half as much as E.
(v) E weighs less than A but more than C.
Which of the following is the lightest in weight?
E is lighter in weight than which of the other two articles?
E is heavier than which of the following two articles?
Which of the following articles is the heaviest in weight?
Given below are pairs of events I and II.Read both the events and decide the relationship. Assume that the information given is true in deciding the answer. Mark answer as
Event (I): The price of gold has gone up in the local market.
Event (II): Indians have won several prizes in designing gold ornaments.
Solution
he increase in the price of gold (Event I) would be caused by broader market or economic factors, such as supply and demand or global market trends.
On the other hand, Indians winning prizes for designing gold ornaments (Event II) is an achievement in craftsmanship and does not directly or immediately influence the price of gold. Therefore, Event I is an effect, but Event II is not the immediate or main cause of it.
Event (I): Today, the prime ministers of countries P and Q have decided to take steps to improve bilateral relations.
Event (II): Next week a committee of foreign ministers and senior officers of country P and Q will work out further steps to improve the relationship.
Event (I): Recently the prices of the personal computers (PCs) have come down.
Event (II): Some school-children are showing keen interest in learning computers.
Event (I): This year bank M has celebrated its silver jubilee.
Event (II): More customers are getting attracted to the market branch of bank M.
A situation and the outcome are presented. Four statements follow thereafter. Each statement is to be separately evaluated in relation to the situation and outcome. Mark answer as
Situation: Abhijit Roy is training for a national swimming meet. His event is 800m freestyle. In winning the last five races, his time has never exceeded 8 minutes. His practice performances, in which he studiously attempts to duplicate all actual racing conditions, have been better. He is a strong favourite among local sportswriters to win the meet, and his coach Prabhu Dayal predicts that he will win in record time. Speed Swimming Gear, in the hope of capitalising on his upcoming victory, has persuaded Roy to be photographed with their goggles, which he always wears in competition. Outcome: Roy clocks his worst time ever and finishes fourth.
The Speed Swimming Gear company was confident that Roy would win the race.
Roy’s coach had cautioned him not to expect to do as wel1 as he had in past races.
After the race, several swimmers complained about the high chlorine content of the water in the pool.
Solution
Chlorine content and Abhijit Roy's performance can't be related because there is no mention of this correlation in the passage. Hence the statement does not support a possible explanation of the outcome
It was revealed after the race that the national swimming meet was fixed.
Each Question n has a statement followed by two assumptions /conclusions. Find the implicit assumption(s)/conclusion(s ).
Statement:
A good system of education in a country is the flower of economic development; it is also its seed.
Assumptions:
I: Economic development leads to educational development in a country.
II. Educational development leads to economic development in a country.
Statement:
There is one thing as important as studying and that is how much is understood.
Assumptions:
I. Studying and understanding go hand in hand.
II. Understanding is as important as studying.
Solution
The statement says that studying is important, but understanding what is studied is just as important. This means that simply reading or memorizing information is not enough; one must also comprehend it.
Now, let’s look at the assumptions. The first assumption says that studying and understanding always happen together. However, this is not necessarily true. A person can study without fully understanding, so this assumption is not implicit.
The second assumption states that understanding is as important as studying. This matches exactly with what the statement says, so this assumption is implicit.
Therefore, only the second assumption is implicit.
Statement:
All birds are dogs and some dogs are cats.
Conclusions:
I. Some cats are not dogs.
II. All dogs are not birds.
Statement:
There are many Indians who are honest. Mohan is an Indian.
Conclusions:
I. Mohan is honest.
II. Mohan is not honest.
Attempt these Question ns based on the information given against each.
In order to qualify in an examination having 6 subjects, a student has to get at least 50% and above marks separately in any 4 subjects and 35% and above in each of the 6 subjects. If a total of 25% candidates have qualified in the examination, then which of the following is definitely true?
“Cases of food-poisoning have been reported from village X. After a dinner party arranged for 100 people, 68 were admitted to the hospital, and 36 were reported to be out of danger. The food, which was cooked and stored in an open space for almost 12 hours, was served after reheating. Investigation is going on.” A news report. Which of the following can be hypothesised from the above information?
“If you want a hassle-free holiday package for city M, then join only our tour. Hurry up; only a few seats available” - An advertisement of XYZ Tourist Company. If the above statement is true then which of the following has been assumed while making the statement?
The State Government’s agency ‘Housewell’ has constructed 500 flats for the middle class but inspite of a shortage of houses, it has not even received 100 applications. Which of the following, if true, could explain this?
For the following questions answer them individually
What is ’Super 301'?
Who finally approves the draft five-year plans?
Which is India’s largest private sector bank?
According to the UNCTAD report, India has acquired the .............. Place in the world, for receiving the largest FDI in 2006:
For attaining 9% growth rate during 11th Plan, investment level has been estimated to be
Central Government has declared 2007 as
‘Aero India 2001’ was organised during February 2007 at
2007 is being celebrated as ‘Friendship year’ between India and
RbI holds .............. equity in National Housing bank
The National Stock Exchange functions from
What is the purpose of the India brand Equity Fund?
On the basis of the size and composition of external debt, World bank has classified India as a
The Planning Commission of India is
What is the percentage of India’s population with respect to the World population?
The novel which is not the work of Orhan Pamuk, the 2006 Nobel laureate in Literature, is
The Chairman of the National Development Council (NDC) is the
The three core values of the Commonwealth Games movement are
Internet was developed upon which among the following operating systems?
Which among the following matches is incorrect?
The Secretary General of the United Nations is
A Nuclear-Risk Reduction Treaty was recently signed between
The mascot of the 33rd National Games was
The theme for the $$21^{st}$$ National Science Day 2007 was
Which among the following movies was given the best Picture Award at the $$97^{th}$$ Oscar Awards 2007
Tagline ‘Empowering People’ is linked with which brand ?
The Chief Minister of Uttarakhand is
Which among the following satellites was successfully launched in March 2007 by ISRO?
The XIX Commonwealth Games are scheduled to be held at Delhi in
The death of the cricket coach of which among the following countries during the 2007 World Cup has created a suspicion?
‘Falcon-I ‘ which was recently in the news is
Japan has signed its first security pact other than US, with which among the following countries?
Devaluation means
Which one of the following pairs is not correctly matched?
The tax which is not shared between the Centre and the States is
Which of the following two countries will jointly host the South Asian Football Championship in 2007 ?
The economic growth of how much per cent has the Indian Credit Rating Agency (ICRA) predicted in the current fiscal year?
GNP (Gross National Product) is the money value of
For the purpose of Census 200 I, which one of the following was taken as being literate?
Consider the following statements
A) GATT was succeeded by the World Trade Organization in the year 1995.
B) Headquarters of WTO are in Doha.
C) World Intellectual Property Organization is a specialized agency of WTO.
Which of the statement(s) given above is/are corect?
Which of the following rates is not decided by the Reserve bank of India (RbI)?

