Group
Group
 Group
Group


 Preferred Source

 Google Discover
JEE Correlation vs Covariance
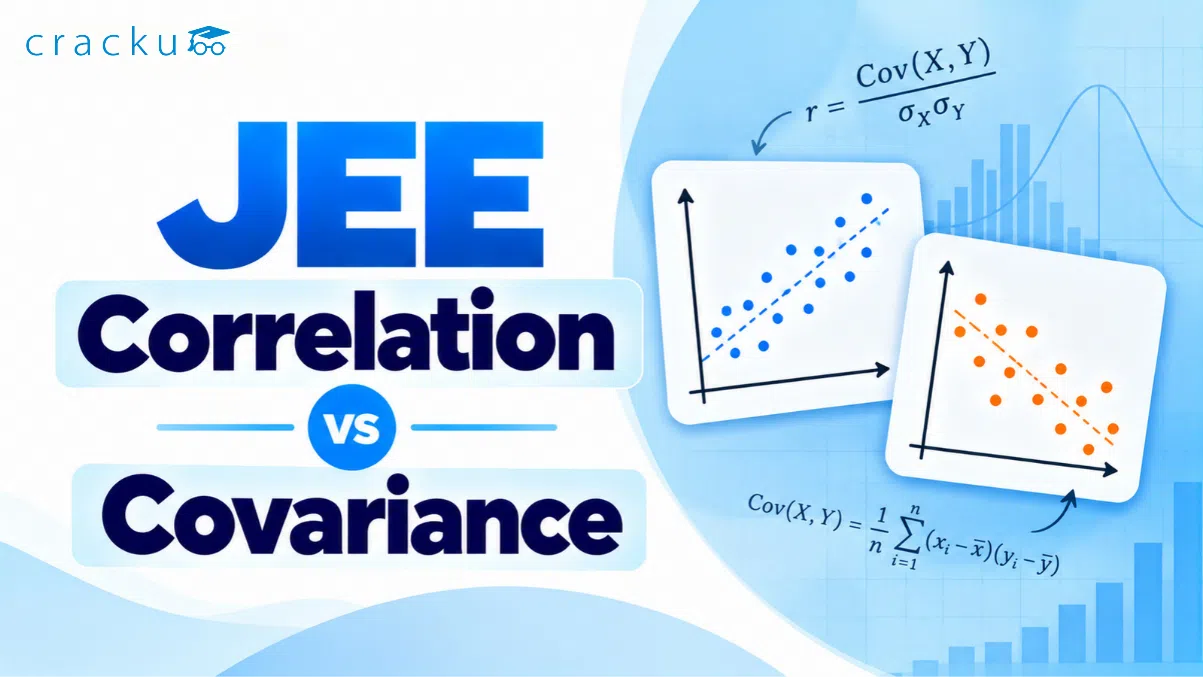
The Difference Between Correlation and Covariance comes down to one idea: covariance tells you the direction in which two variables move together, while correlation tells you the direction and the strength on a fixed scale from $$-1$$ to $$1$$. Both are built from the same deviations about the mean, so students often treat them as interchangeable and lose marks. This guide separates the two using formulas, sign rules, scale behaviour and a fully worked numerical example.
What are Correlation and Covariance?
Covariance
Covariance measures how two variables vary jointly about their respective means. If large values of $$x$$ tend to pair with large values of $$y$$, the products of deviations are mostly positive and covariance is positive. If large $$x$$ pairs with small $$y$$, covariance is negative.
For $$n$$ paired observations $$(x_i, y_i)$$:
$$Cov(x,y) = \frac{1}{n}\sum_{i=1}^{n}(x_i - \bar{x})(y_i - \bar{y})$$
The expanded working form, which is faster in an exam, is:
$$Cov(x,y) = \frac{1}{n}\sum_{i=1}^{n} x_i y_i - \bar{x}\,\bar{y}$$
Note that $$Cov(x,x) = \sigma_x^{2}$$, so variance is just the covariance of a variable with itself.
Correlation
The Karl Pearson coefficient of correlation, written $$r$$ or $$r_{xy}$$, is covariance divided by the product of the two standard deviations. That division strips away the units and forces the value into a closed interval.
$$r = \frac{Cov(x,y)}{\sigma_x\,\sigma_y}, \qquad -1 \le r \le 1$$
The bound follows from the Cauchy-Schwarz inequality, which gives $$|Cov(x,y)| \le \sigma_x \sigma_y$$. So correlation is nothing but a normalised covariance.
Key Differences Between Correlation and Covariance
| Property | Covariance | Correlation |
|---|---|---|
| What it measures | Direction of joint variation only | Direction and strength of a linear relationship |
| Defining formula | $$Cov(x,y) = \frac{1}{n}\sum (x_i-\bar{x})(y_i-\bar{y})$$ | $$r = \dfrac{Cov(x,y)}{\sigma_x \sigma_y}$$ |
| Range of values | Any real number, from $$-\infty$$ to $$\infty$$ | Restricted to $$[-1, 1]$$ |
| Units | Product of the units of $$x$$ and $$y$$ (for example kg·cm) | Dimensionless pure number |
| Change of scale | Changes: multiplying $$x$$ by $$a$$ and $$y$$ by $$c$$ multiplies covariance by $$ac$$ | Unchanged in magnitude; sign flips only if $$ac \lt 0$$ |
| Change of origin | Unaffected by adding constants to $$x$$ or $$y$$ | Unaffected by adding constants |
| Comparability | Two covariances from different data sets cannot be compared directly | Values from different data sets are directly comparable |
| Value for a perfect linear fit | Equals $$\pm\,\sigma_x\sigma_y$$, no fixed number | Exactly $$+1$$ or $$-1$$ |
| Self-relation | $$Cov(x,x) = \sigma_x^{2}$$ | $$r_{xx} = 1$$ |
| Typical use | Intermediate quantity for regression coefficients and variance of a sum | Final answer reporting strength of association |
Formulas, Shortcuts and a Worked Example
For raw data with awkward means, use the product-moment form that avoids decimals entirely:
$$r = \frac{n\sum x_i y_i - \sum x_i \sum y_i}{\sqrt{n\sum x_i^{2} - \left(\sum x_i\right)^{2}}\;\sqrt{n\sum y_i^{2} - \left(\sum y_i\right)^{2}}}$$
Two more relations connect covariance to the rest of the statistics chapter:
- Variance of a sum: $$Var(x+y) = \sigma_x^{2} + \sigma_y^{2} + 2\,Cov(x,y)$$
- Regression coefficients: $$b_{yx} = \dfrac{Cov(x,y)}{\sigma_x^{2}}$$ and $$b_{xy} = \dfrac{Cov(x,y)}{\sigma_y^{2}}$$, so $$r^{2} = b_{yx}\,b_{xy}$$
Worked example: Take $$x = 1, 2, 3, 4, 5$$ and $$y = 2, 4, 5, 4, 5$$.
| Step | Working | Value |
|---|---|---|
| Means | $$\bar{x} = 15/5,\ \bar{y} = 20/5$$ | $$\bar{x}=3,\ \bar{y}=4$$ |
| Deviations of x | $$-2, -1, 0, 1, 2$$ | Sum $$= 0$$ |
| Deviations of y | $$-2, 0, 1, 0, 1$$ | Sum $$= 0$$ |
| Sum of products | $$4 + 0 + 0 + 0 + 2$$ | $$6$$ |
| Covariance | $$6/5$$ | $$1.2$$ |
| Variances | $$\sigma_x^{2} = 10/5,\ \sigma_y^{2} = 6/5$$ | $$2$$ and $$1.2$$ |
| Correlation | $$r = \dfrac{1.2}{\sqrt{2}\times\sqrt{1.2}} = \sqrt{0.6}$$ | $$\approx 0.775$$ |
Covariance $$1.2$$ by itself says only that the relationship is positive. The value $$0.775$$ tells you the association is strong but not perfect. Keeping the covariance formula, the Pearson formula and the regression relations on one page saves rework, and a compact set of JEE Mains Formula Sheets is useful when you revise the whole statistics chapter in a single sitting.
Sign, Magnitude and the Effect of Change of Origin and Scale
The sign of covariance and the sign of correlation are always identical, because standard deviations are non-negative. The magnitudes behave very differently, and this is the single most tested idea in transformation questions.
| Transformation applied | New covariance | New correlation |
|---|---|---|
| $$x \to x + b,\ y \to y + d$$ | $$Cov(x,y)$$, unchanged | $$r$$, unchanged |
| $$x \to ax,\ y \to cy$$ with $$a, c \gt 0$$ | $$ac\,Cov(x,y)$$ | $$r$$, unchanged |
| $$x \to ax + b,\ y \to cy + d$$ | $$ac\,Cov(x,y)$$ | $$r$$ if $$ac \gt 0$$, $$-r$$ if $$ac \lt 0$$ |
| Both variables negated | Unchanged | Unchanged |
Apply this to the worked data. If you replace $$x$$ by $$2x + 7$$ and $$y$$ by $$3y - 1$$, the covariance becomes $$2 \times 3 \times 1.2 = 7.2$$, while $$r$$ stays at $$0.775$$. If instead $$y$$ is replaced by $$-3y$$, the covariance becomes $$-3.6$$ and the correlation becomes $$-0.775$$.
Interpretation of magnitude follows the same logic. A covariance of $$500$$ is not stronger than a covariance of $$5$$ until you know the standard deviations; a correlation of $$0.9$$ is always stronger than a correlation of $$0.4$$. When you drill statistics from a topic-wise bank of JEE Questions, notice how often the examiner changes units or shifts the origin and expects you to answer without recomputing anything.
Similarities Between Correlation and Covariance
- Both are computed from deviations about the mean of the same paired data set.
- Both are symmetric: $$Cov(x,y) = Cov(y,x)$$ and $$r_{xy} = r_{yx}$$.
- Both always carry the same sign, and both are zero together.
- Both are unaffected by a change of origin.
- Both detect only linear association. For $$y = x^{2}$$ on symmetric data such as $$x = -2, -1, 0, 1, 2$$, both come out as zero even though the variables are perfectly related.
- Both are sensitive to extreme observations, since a single outlier can dominate the sum of products.
One caution that examiners like: zero covariance implies zero correlation and means the variables are uncorrelated, but it does not mean they are independent. Independence forces covariance to be zero; the converse is false.
JEE Exam Perspective
The JEE Main statistics syllabus is built around mean, median, mode, variance and standard deviation for grouped and ungrouped data, and questions from this chapter appear almost every shift. Covariance and correlation are not separate high-weightage headings, but the machinery they share with variance shows up constantly, especially in questions that change each observation to $$ax + b$$ and ask for the new mean, new variance or new standard deviation.
Points worth locking in before the exam:
- Variance scales by $$a^{2}$$, standard deviation by $$|a|$$, covariance by $$ac$$, and correlation not at all.
- Adding a constant to every observation changes the mean but leaves variance, covariance and correlation untouched.
- If a question supplies regression coefficients, the correlation coefficient is the square root of their product with the common sign of the two coefficients.
- Both regression coefficients cannot have magnitudes greater than one simultaneously, since their product is $$r^{2} \le 1$$.
Sorting the statistics questions in the JEE Mains Previous Papers by year makes the pattern obvious: most of them reduce to a mean shift, a scale change or a corrected observation rather than to heavy computation.
Conclusion
Covariance and correlation answer the same first question and different second questions. Covariance fixes the direction of the relationship and carries the units of both variables, so its numerical size means nothing on its own. Correlation divides that covariance by $$\sigma_x \sigma_y$$, producing a unit-free number between $$-1$$ and $$1$$ that can be compared across any two data sets. Remember that correlation is scale-invariant while covariance is not, keep the transformation rules ready, and treat a zero value as evidence of no linear relation rather than of independence.