Group
Group

IIM Average Package 2026
IIM salary trends have gone up from a basic range of ₹15 LPA to higher average package close to ₹35 LPA in 2025. BLACKI IIMs have consistently reported higher ROI and average salary packages over the last 6 years. Among all the 21 IIMs in India, IIM Bangalore has the highest range of average package around ₹35.31 LPA while IIM Bodh Gaya has the lowest average package valued at ₹13 LPA.
The 6-year CAGR spread across old and new IIMs is between 1.9% to 9.3%. IIM Jammu has the highest 6 year CAGR of 9.3%. With the growth of AI and changing market demands, it is important to analyze average packages at all IIMs across 2020-2025 to set realistic salary expectations for IIMs. After IIM Bangalore, IIM Ahmedabad and IIM Calcutta offer the highest range of average packages.
IIM Average Package Year-Wise Trends
Compare the averages for top IIMs over a span of 3-5 years to check comprehensive growth. IIM Trichy’s 3 year rolling average reaches ₹19.75 LPA while IIM Raipur's stands at ₹19.34 LPA. Both IIM Trichy and Raipur have consistent placement records over the last few years holding the top 2 positions.
5-Year Average LPA
Both IIM Jammu and Amritsar offer 5-year averages in the ₹14-15 LPA range but Jammu offers better average in a 3-year window. Check the table below for a detailed 5-Year average package of IIMs.
B-School | 5-Year Average (INR LPA) |
IIM Trichy | 18.22 |
IIM Raipur | 18.17 |
IIM Udaipur | 17.52 |
IIM Rohtak | 17.31 |
IIM Ranchi | 17.22 |
IIM Nagpur | 15.80 |
IIM Kashipur | 15.47 |
IIM Vizag | 15.12 |
IIM Amritsar | 14.69 |
IIM Jammu | 14.41 |
IIM Sambalpur | 14.18 |
IIM Simaur | 12.81 |
IIM Bodh Gaya | 12.76 |
4-Year Average LPA
IIM Rohtak’s 3 year average is higher at ₹18.91 LPA close to Raipur and above Udaipur but its 5-year average assigns it the 4th rank. Know the rolling 4-Year average package at IIMs.
B-School | 4-Year Average (INR LPA) |
IIM Trichy | 19.07 |
IIM Raipur | 18.94 |
IIM Udaipur | 18.55 |
IIM Rohtak | 18.20 |
IIM Ranchi | 17.85 |
IIM Nagpur | 16.45 |
IIM Kashipur | 15.83 |
IIM Vizag | 15.75 |
IIM Jammu | 15.43 |
IIM Amritsar | 15.19 |
IIM Sambalpur | 14.93 |
IIM Simaur | 13.62 |
IIM Bodh Gaya | 13.47 |
3-Year Average LPA
Compare average salary packages across IIMs in a 3-year window. IIMs having consistent rolling averages across 3-year, 4-year and 5-year windows have higher placement quality.
B-School | 3-Year Average (INR LPA) |
IIM Trichy | 19.75 |
IIM Raipur | 19.34 |
IIM Rohtak | 18.91 |
IIM Udaipur | 18.79 |
IIM Ranchi | 18.41 |
IIM Nagpur | 17.03 |
IIM Kashipur | 16.03 |
IIM Jammu | 15.98 |
IIM Vizag | 15.98 |
IIM Sambalpur | 15.50 |
IIM Amritsar | 15.38 |
IIM Bodh Gaya | 13.95 |
IIM Simaur | 13.89 |
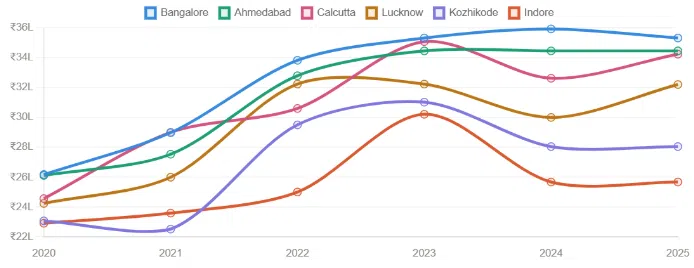
Top IIMs Average Package Comparison Over the Years
Among the top IIMs, older colleges like IIM Ahmedabad and IIM Bangalore lead in average CTC trends over the years. Top IIMs show consistency across their average packages over the years. Average packages offered at top IIMs have risen over the years leading to a high ROI and better career opportunities. Overall, the top IIMs average package is between ₹15 to ₹35 LPA based on the latest placement data for 2025.
Top IIMs | Average Package Year-wise Data (INR LPA) | ||||
2025 | 2024 | 2023 | 2022 | 2021 | |
IIM Ahmedabad | 34.45 | 35.17 | 34.45 | 32.79 | 27.54 |
IIM Bangalore | 35.35 (2026) | 34.3 | 35.31 | 33.82 | 28.98 |
IIM Kozhikode | 28.05 | 28.05 | 31.02 | 29.5 | 22.53 |
IIM Calcutta | 36 (2026) | 32.62 | 35.07 | 30.60 | 29.00 |
IIM Lucknow | 32.2 | 30.00 | 32.23 | 32.23 | 26.00 |
IIM Mumbai | 25.4 | 47.5 (top 10%) 41.4 (top 20%) 34.5 (top 50%) | 27.75 | 25.4 | - |
IIM Indore | 25.68 | 25.68 | 30.21 | 25.01 | 23.6 |
IIM Shillong | 26.44 | 26.44 | 26.96 | 23.10 | 19.17 |
IIM Placement Trends: Growth, Decline & Market Impact
IIM Jammu, a 3rd generation IIM has the highest 6 year CAGR at 9.3%. The positive annual growth in average CTC at IIM Jammu indicates strong placement trends even at new IIMs. IIM Indore, which is often considered a 1st-2nd generation flagship IIM, has the lowest 1.9% CAGR based on 6 year data. The average package at IIM Indore in 2025 saw a 15% decline from its peak average CTC of ₹30.21 LPA in 2023.
List of IIMs | 2025 | 2024 | 2023 | 2022 | 2021 | 2020 | 6Y CAGR |
IIM Ahmedabad | 34.45 | 35.17 | 34.45 | 32.79 | 27.54 | 26.12 | 4.7% |
IIM Bangalore | 35.35 (2026) | 35.92 | 35.31 | 33.82 | 28.98 | 26.18 | 5.1% |
IIM Kozhikode | 28.05 | 28.05 | 31.02 | 29.5 | 22.53 | 23.08 | 3.3% |
IIM Calcutta | 36 (2026) | 32.62 | 35.07 | 30.60 | 29.00 | 24.57 | 5.6% |
IIM Lucknow | 33.2 (2026) | 30.00 | 32.23 | 32.23 | 26.00 | 24.25 | 4.8% |
IIM Mumbai | 34.5 | 34.5 | 27.75 | 25.4 | - | - | 5% (4Y) |
IIM Indore | 25.68 | 25.68 | 30.21 | 25.01 | 23.6 | 22.92 | 1.9% |
IIM Shillong | 26.44 | 26.44 | 26.96 | 23.10 | 19.17 | 18.76 | 5.8% |
IIM Trichy | 19.27 | 19.43 | 20.55 | 17.01 | 14.85 | 14.96 | 4.4% |
IIM Udaipur | 17.50 | 18.77 | 20.10 | 17.82 | 13.42 | 12.93 | 6.1% |
IIM Raipur | 18.83 | 18.15 | 21.04 | 17.73 | 15.11 | 15.20 | 4.4% |
IIM Ranchi | 19.24 | 18.69 | 17.30 | 16.17 | 14.69 | 15.11 | 4.2% |
IIM Rohtak | 18.73 | 19.27 | 18.73 | 16.06 | 13.74 | 13.70 | 7.9% |
IIM Kashipur | 14.95 | 15.04 | 18.11 | 15.21 | 14.05 | 13.82 | 3.5% |
IIM Vizag | 15.72 | 15.61 | 16.61 | 15.06 | 12.62 | 13.08 | 3.7% |
IIM Amritsar | 14.63 | 15.00 | 16.51 | 14.62 | 12.68 | 12.61 | 3.1% |
IIM Jammu | 16.04 | 15.48 | 16.43 | 13.78 | 10.34 | 10.64 | 9.3% |
IIM Sambalpur | 18.07 | 16.29 | 16.74 | 14.69 | 13.22 | 13.06 | 5.5% |
IIM Simaur | 13.30 | 13.93 | 14.45 | 12.81 | 9.58 | 11.27 | 6.4% |
IIM Bodh Gaya | 13.00 | 13.90 | 14.96 | 12.01 | 9.92 | 9.56 | 3.0% |
IIM Nagpur | 18.07 | 16.29 | 16.74 | 14.69 | 13.22 | 13.06 | 6.4% |
The 2nd and 3rd generation IIMs offer average packages between ₹12-20 LPA approximately on a rolling basis for about 3-5 years. Among all the 2nd and 3rd generation IIMs, IIM Trichy and IIM Raipur offer the highest average placements over the last 3-5 years. The table below reveals that both IIM Jammu and IIM Amritsar offer average placements between ₹14-15 LPA but IIM Jammu has a higher average placement trends compared to IIM Amritsar in the past 3-5 years.
B-school Name | 5-Year Average (LPA) | 4-Year Average (LPA) | 3-Year Average (LPA) |
IIM Trichy | 18.22 | 19.07 | 19.75 |
IIM Raipur | 18.17 | 18.94 | 19.34 |
IIM Udaipur | 17.52 | 18.55 | 18.79 |
IIM Rohtak | 17.31 | 18.20 | 18.91 |
IIM Ranchi | 17.22 | 17.85 | 18.41 |
IIM Nagpur | 15.80 | 16.45 | 17.03 |
IIM Kashipur | 15.47 | 15.83 | 16.03 |
IIM Vizag | 15.12 | 15.75 | 15.98 |
IIM Amritsar | 14.69 | 15.19 | 15.38 |
IIM Jammu | 14.41 | 15.43 | 15.98 |
IIM Sambalpur | 14.18 | 14.93 | 15.50 |
IIM Simaur | 12.81 | 13.62 | 13.89 |
IIM Bodh Gaya | 12.76 | 13.47 | 13.95 |
Which IIM Has the Highest Average Package Recently?
IIM Bangalore has the highest average package recently in 2025. The 2nd highest average package is offered at IIM Ahmedabad and third highest average CTC was noted at IIM Calcutta recently. IIM Bangalore average salary package for 2025 stood at ₹35.31 LPA, IIM Ahmedabad at ₹34.45 LPA and IIM Calcutta at ₹34.23 LPA.
BLACKI IIMs offer the highest average salary packages among all IIMs in India. The top 5 IIMs with highest recorded average package in 2025 placements are as follows:
Top IIMs | 2025 Highest Average Packages (INR LPA) |
IIM Bangalore | 35.31 |
IIM Ahmedabad | 34.45 |
IIM Calcutta | 34.23 |
IIM Mumbai | 34.10 |
IIM Lucknow | 32.20 |
IIM Average Package 2025 vs Previous Years
Compared to 2024 average package, newer IIMs show a slight decline of 0.3 to 1% in CTC. Top IIMs such as IIM Calcutta and Lucknow have indicated positive trends in average CTC growth from 2024 to 2025. Other 2nd and 3rd generation IIMs such as IIM Jammu, Vizag, Samabalpur, and others have offered higher average packages in 2025 compared to previous years. Check the table below for detailed information on IIM average package 2025 vs previous years.
IIMs | 2025 INR LPA) | 2020 - 2024 Average Package Range (Low to High) |
Bangalore | 35.31 | 26.2 to 35.9 |
Ahmedabad | 34.45 | 26.1 to 34.5 |
Calcutta | 34.23 | 24.6 to 35.1 |
Mumbai | 34.10 | 25.4 to 34.5 |
Lucknow | 32.20 | 24.3 to 32.2 |
Kozhikode | 28.05 | 22.5 to 31.0 |
Shillong | 26.44 | 18.8 to 27.0 |
Indore | 25.68 | 22.9 to 30.2 |
Trichy | 19.27 | 14.8 to 20.6 |
Ranchi | 19.24 | 14.7 to 18.7 |
Raipur | 18.83 | 15.1 to 21.0 |
Rohtak | 18.73 | 13.7 to 19.3 |
Sambalpur | 18.07 | 13.1 to 16.7 |
Nagpur | 18.07 | 13.1 to 16.7 |
Udaipur | 17.50 | 12.9 to 20.1 |
Jammu | 16.04 | 10.3 to 16.4 |
Vizag | 15.72 | 12.6 to 16.6 |
Kashipur | 14.95 | 13.8 to 18.1 |
Amritsar | 14.63 | 12.6 to 16.5 |
Simaur | 13.30 | 9.6 to 14.4 |
Bodh Gaya | 13.00 | 9.6 to 15.0 |
What Factors Affect IIM Average Salary Trends?
Factors affecting IIM average salary trends include number of offers received, new recruiters percentage, alumni network, and more. Recently, factors such as the rapid growth of AI and unstable geopolitical ecosystem has led to changes in the recruiter preferences affecting salaries. Common factors affecting IIM average salary trends are listed here.
- Ranking or reputation of the institution
- Number of students graduating in each batch
- Number of total recruiters visiting campus
- Number of first-time recruiters participating in the process
- Strong alumni base
- Trust of the recruitment partners through consistent participation every year
- PPOs received in Summer Internship Program (SIPs) converted to placements
- Number of consulting firms visiting campus as it is one of the most in-demand domain
- Number of tech giants and major companies visiting campus like PwC India
- Growth of particular industry like Pharma, FMCG or IT
- Changes in business models due to growth of AI
- Overall market conditions
Check the salary trends at top 6 IIMs which include the average package secured by MBA graduates from 2020-2025.
Old IIMs (1st Generation IIMs)
Year wise representation of average CTC at BLACKI IIMs provides a clear picture at the salary growth and trends. The top 6 IIMs which lead in placements have consistently offered an average package between ₹34-35 LPA over the past 6 years.
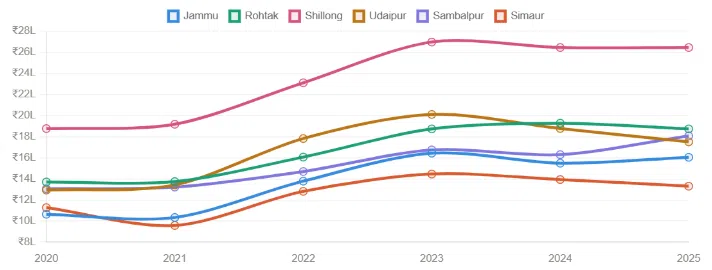
Mid-New IIMs (2nd-3rd Generation IIMs)
Newer IIMs trajectory is much faster over the last 6 years compared to older or 1st generation IIMs. Even though the average salary at new IIMs is lower compared to older IIMs, the 6 years CAGR shows strong upward momentum. You can choose IIM Jammu, Rohtak, Sirmaur, etc as these newer IIMs are focusing more on recruiter preference, brand value and alumni network.
IIM Average Package 2026: Conclusion
Choosing an IIM based only on brand value is no longer enough in today’s competitive MBA landscape. Students should carefully analyze IIM average package trends, CAGR growth, recruiter quality, and placement consistency before making a final decision. While BLACKI IIMs continue to dominate with average packages above ₹30 LPA, several second and third-generation IIMs have also shown strong placement growth over the last few years.
The IIM Average Package 2026 analysis clearly shows that institutes like IIM Trichy, IIM Raipur, IIM Rohtak, and IIM Jammu are improving rapidly in terms of salary growth and recruiter participation. Candidates should focus on long-term career opportunities, alumni network, and ROI rather than just short-term placement figures while selecting the right IIM for MBA admissions.