Question 74
The following bar graph shows the amount(in Lakh Rs.) invested by a Company in purchasing raw material over the years and the values (in Lakh Rs.) of finished goods sold by the Company over the years.
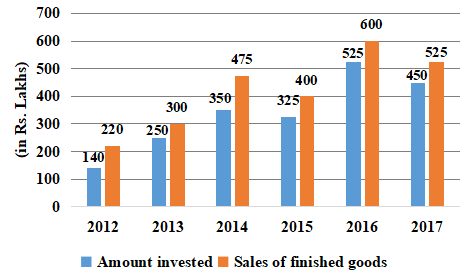
The ratio of total amount invested for purchasing raw material from 2013 to 2015 to the total sales of finished goods in 2014, 2016 and 2017 is:
Solution
Total amount invested for purchasing raw material from 2013 to 2015 = 250 + 350 + 325 = 925
The total sales of finished goods in 2014, 2016 and 2017 = 475 + 600 + 525 = 1600
Required ratio = 925 : 1600
= 37 : 64
Hence, the correct answer is Option D
Get AI Help
Create a FREE account and get:
- Free SSC Study Material - 18000 Questions
- 230+ SSC previous papers with solutions PDF
- 100+ SSC Online Tests for Free


