Instructions
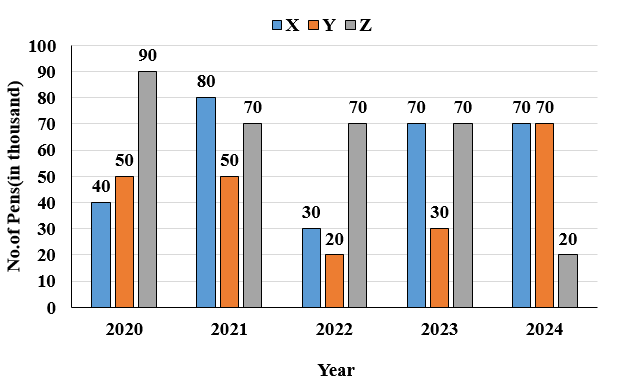
Study the following bar-graph carefully and answer the following question. The bar-graph shows the number of pens (in thousand) sold by three shopkeepers X, Y and Z in 5 different years.
Question 64
The total number of pens sold by shopkeeper X in years 2020 and 2022 taken together is what percentage less than the total number of pens sold by shopkeeper Z in years 2021 and 2024 taken together? (correct to two decimal places)
Create a FREE account and get:
- Download Maths Shortcuts PDF
- Get 300+ previous papers with solutions PDF
- 500+ Online Tests for Free


