Instructions
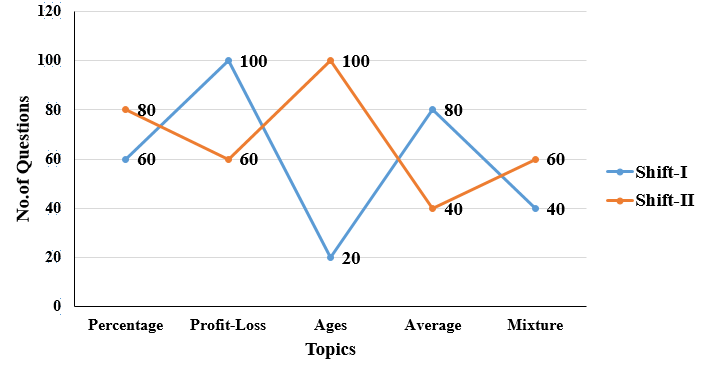
The following line graph shows the number of questions asked from different topics of quantitative aptitude in two shifts of CAT exam. Study the following line graph carefully and answer the question that follows.
Question 62
The number of questions asked in shift I from the topic Profit-Loss is what percent more than the number of questions asked in shift II from the topic Average?
Create a FREE account and get:
- Download Maths Shortcuts PDF
- Get 300+ previous papers with solutions PDF
- 500+ Online Tests for Free


