Question 61
the following Pie charts represent the distribution of candidates who were enrolled for competitive examination and the candidates (out of those enrolled) who passed the exam from five different institutes P, Q, R, S and T. Fig.(i) Total number of candidates enrolled in five different institutes = 7500
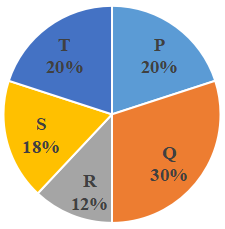
Fig.(ii) Total number of candidates passed the examination from five Institutes = 4000

What is the pass percentage for institute Q? (correct up to one decimal place.)
Create a FREE account and get:
- Free SSC Study Material - 18000 Questions
- 230+ SSC previous papers with solutions PDF
- 100+ SSC Online Tests for Free


