
Join Our JEE Preparation Group
Prep with like-minded aspirants; Get access to free daily tests and study material.
Sign in
Please select an account to continue using cracku.in
↓ →
Join Our JEE Preparation Group
Prep with like-minded aspirants; Get access to free daily tests and study material.
Which of the following graphs is correct for a second-order reaction?
The half-life equation for an $$n^{\text{th}}$$-order chemical reaction follows the general proportionality:
$$t_{1/2}\propto\frac{1}{a_0^{n-1}}$$
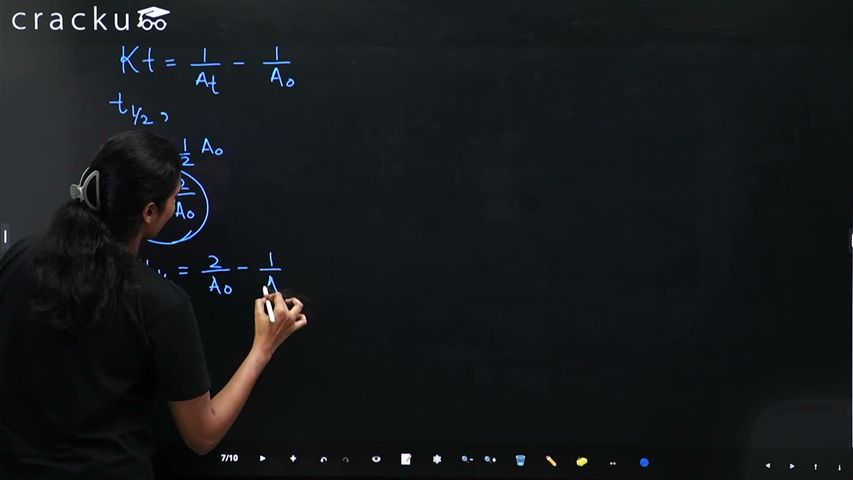
For a second-order reaction, n=2:
$$t_{1/2}=\frac{1}{k a_0}$$
Rearranging in the form y=mx+c:
$$t_{1/2}=\left(\frac{1}{k}\right)\left(\frac{1}{a_0}\right)+0$$
- y-axis: $$t_{1/2}$$
- x-axis: $$\frac{1}{a_0}$$
- Slope: $$\frac{1}{k}$$
- y-intercept: 0
Therefore, the graph of $$t_{1/2}$$ versus $$\frac{1}{a_0}$$ is a straight line passing through the origin with a positive slope.
Correct option: (A)
Was this solution helpful?
Click on the Email ☝️ to Watch the Video Solution
Create a FREE account and get:
_1.webp)

Educational materials for JEE preparation

Ask our AI anything

AI can make mistakes. Please verify important information.
AI can make mistakes. Please verify important information.
