Question 57
The given bar graph shows the imports and exports (in crore 2) of steel for 5 years from 2014 to 2018.
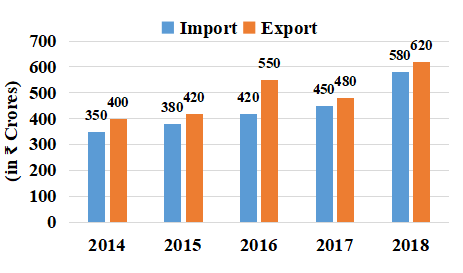
What is the ratio of average export to average import over the five years?
Create a FREE account and get:
- Free SSC Study Material - 18000 Questions
- 230+ SSC previous papers with solutions PDF
- 100+ SSC Online Tests for Free


