Question 54
Study the given table and answer the question that follows.
The table shows the annual consumption (in hundred tonnes) of tea in five states (A, B, C, D and E) across six years (2014 to 2019).
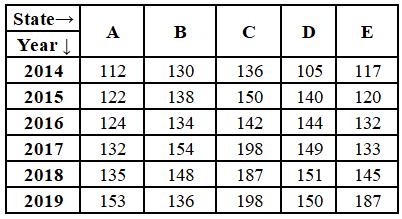
The consumption of tea in which state and year is closest to the average consumption of tea in State A over six years?
Create a FREE account and get:
- Free SSC Study Material - 18000 Questions
- 230+ SSC previous papers with solutions PDF
- 100+ SSC Online Tests for Free


