Sign in
Please select an account to continue using cracku.in
↓ →
Join Our JEE Preparation Group
Prep with like-minded aspirants; Get access to free daily tests and study material.
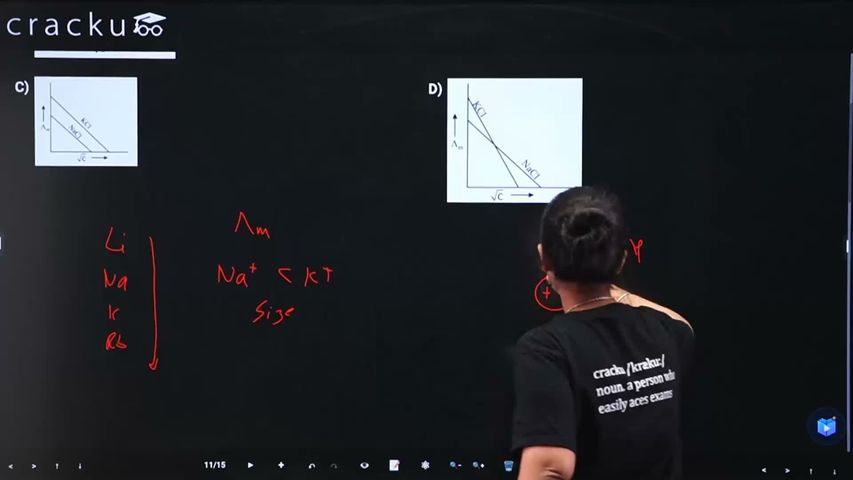
Which one of the following graphs between molar conductivity $$\Lambda_m$$ versus $$\sqrt{C}$$ is correct?
For strong electrolytes, the variation of molar conductivity with concentration is linear and follows the Debye-Hückel-Onsager relation:
$$\Lambda_m = \Lambda_m^\circ - A\sqrt{C}$$
Where:
Since both salts are strong 1:1 electrolytes, plotting $$\Lambda_m$$ against $$\sqrt{C}$$ yields a straight line with a negative slope for both.
To identify which line sits higher on the graph, we compare their limiting molar conductivities ($$\Lambda_m^\circ$$) using Kohlrausch's law:
$$\Lambda_m^\circ(\text{KCl}) = \lambda^\circ(\text{K}^+) + \lambda^\circ(\text{Cl}^-)$$
$$\Lambda_m^\circ(\text{NaCl}) = \lambda^\circ(\text{Na}^+) + \lambda^\circ(\text{Cl}^-)$$
Since the chloride anion ($$\text{Cl}^-$$) is common to both salts, the difference depends solely on the alkali metal cations:
$$\lambda^\circ(\text{K}^+) > \lambda^\circ(\text{Na}^+) \implies \Lambda_m^\circ(\text{KCl}) > \Lambda_m^\circ(\text{NaCl})$$
Because $$\text{KCl}$$ maintains a higher molar conductivity than $$\text{NaCl}$$ at any given concentration, its linear plot must have a higher vertical intercept and lie entirely above the line for $$\text{NaCl}$$.
Click on the Email ☝️ to Watch the Video Solution
Create a FREE account and get:


Educational materials for JEE preparation

Ask our AI anything

AI can make mistakes. Please verify important information.
AI can make mistakes. Please verify important information.
