Sign in
Please select an account to continue using cracku.in
↓ →
Join Our JEE Preparation Group
Prep with like-minded aspirants; Get access to free daily tests and study material.
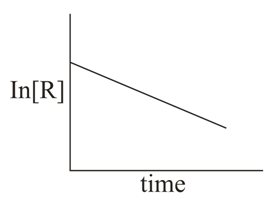
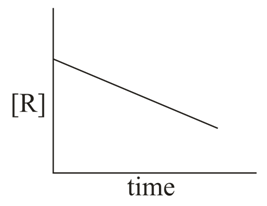
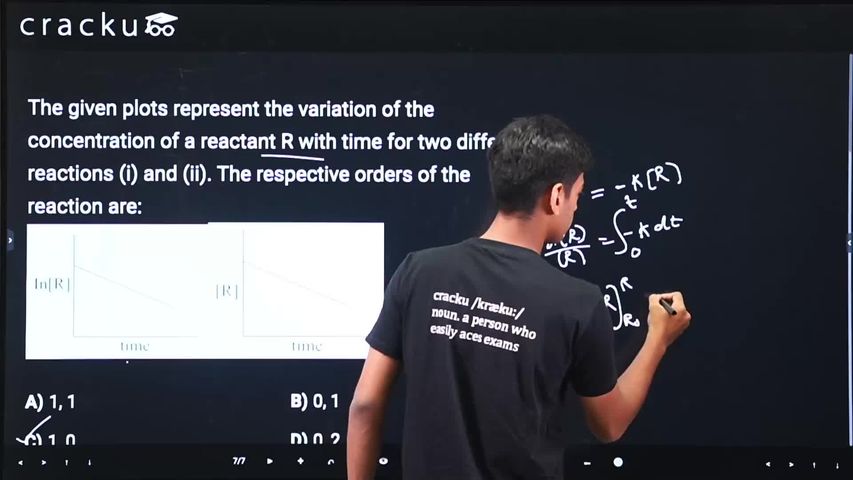
The given plots represent the variation of the concentration of a reactant R with time for two different reactions (i) and (ii). The respective orders of the reaction are:
Click on the Email ☝️ to Watch the Video Solution
Create a FREE account and get:


Educational materials for JEE preparation

Ask our AI anything

AI can make mistakes. Please verify important information.
AI can make mistakes. Please verify important information.
