Join Our JEE Preparation Group
Prep with like-minded aspirants; Get access to free daily tests and study material.
Sign in
Please select an account to continue using cracku.in
↓ →
Join Our JEE Preparation Group
Prep with like-minded aspirants; Get access to free daily tests and study material.
For 1 mol of an ideal gas at a constant temperature $$T$$, the plot of $$(\log P)$$ against $$(\log V)$$ is a ($$P$$ : Pressure, $$V$$ : Volume)
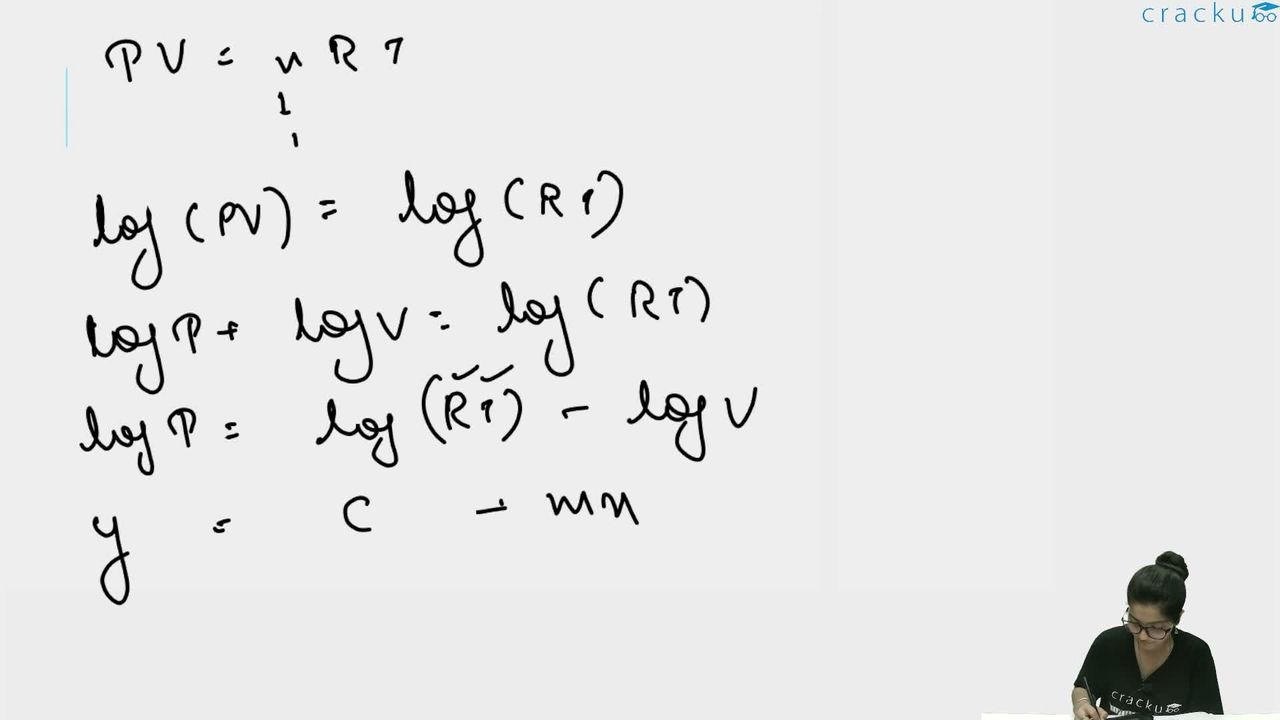
The ideal-gas equation for 1 mole is $$PV = RT$$, where $$R$$ is the gas constant and $$T$$ is the absolute temperature.
Take the common logarithm (base 10) of both sides:
$$\log(PV) = \log(RT)$$
Using the property $$\log(ab) = \log a + \log b$$, we get
$$\log P + \log V = \log(RT)$$ $$-(1)$$
Re-arrange $$-(1)$$ to express $$\log P$$ in terms of $$\log V$$:
$$\log P = \log(RT) - \log V$$ $$-(2)$$
Compare $$-(2)$$ with the straight-line form $$y = c + mx$$.
Here, $$y \equiv \log P$$, $$x \equiv \log V$$, the intercept is $$\log(RT)$$ (a constant at fixed $$T$$), and the slope $$m = -1$$.
Therefore, the graph of $$(\log P)$$ (vertical axis) versus $$(\log V)$$ (horizontal axis) is a straight line with slope $$-1$$, i.e. a straight line slanting downwards from left to right.
Hence, the correct choice is
Option B which is: Straight line with a negative slope.
Was this solution helpful?
Click on the Email ☝️ to Watch the Video Solution
Create a FREE account and get:
_1.webp)

Educational materials for JEE preparation

Ask our AI anything

AI can make mistakes. Please verify important information.
AI can make mistakes. Please verify important information.