Sign in
Please select an account to continue using cracku.in
↓ →
Join Our JEE Preparation Group
Prep with like-minded aspirants; Get access to free daily tests and study material.
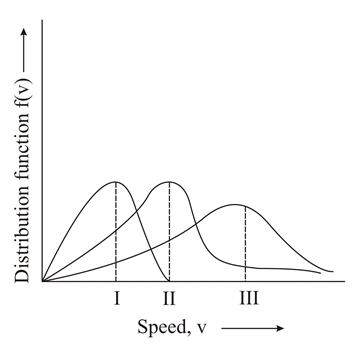
Points I, II and III in the following plot respectively correspond to (V$$_{mp}$$: most probable velocity)
The formula for the most probable velocity (Vmp) of a gas molecule based on the Maxwell-Boltzmann distribution is:
Vmp = square root of (2 * R * T / M)
Where:
From this formula, we can see that:
Therefore, Vmp increases when Temperature (T) increases or Molar Mass (M) decreases.
We need to compare the values of Vmp for three specific cases:
Let's look at the ratio of (T / M) for each option to determine the relative order of their speeds:
Comparing the ratios calculated above: 10.71 < 12.50 < 150.00
This gives us the order of increasing most probable velocity: Vmp(N2 at 300 K) < Vmp(O2 at 400 K) < Vmp(H2 at 300 K)
Looking at the provided Maxwell-Boltzmann distribution curves along the x-axis (Speed, v):
Therefore:
Click on the Email ☝️ to Watch the Video Solution
Create a FREE account and get:


Educational materials for JEE preparation

Ask our AI anything

AI can make mistakes. Please verify important information.
AI can make mistakes. Please verify important information.
