Sign in
Please select an account to continue using cracku.in
↓ →
Join Our JEE Preparation Group
Prep with like-minded aspirants; Get access to free daily tests and study material.
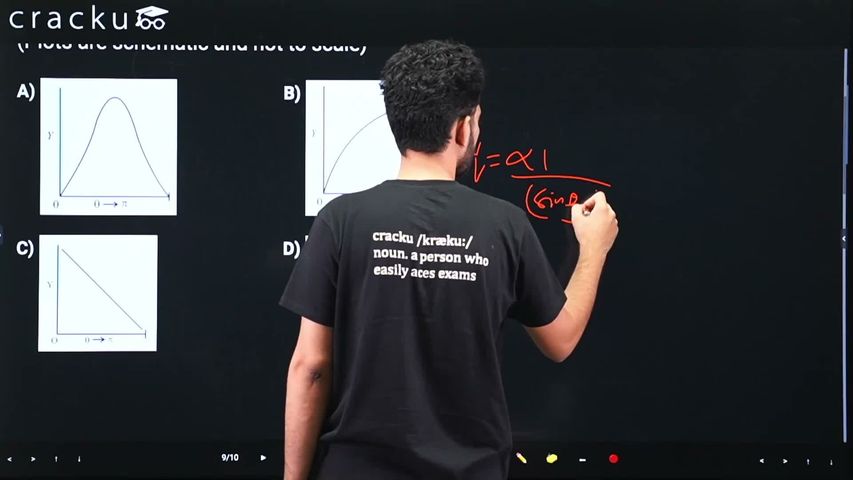
The graph which depicts the results of Rutherford gold foil experiment with $$\alpha$$-particles is:
$$\theta$$: Scattering angle
Y: Number of scattered $$\alpha$$-particles detected
(Plots are schematic and not to scale)
To determine the correct graph for the Rutherford gold foil experiment, we need to look at the relationship between the number of scattered $$\alpha$$-particles ($$Y$$) and the scattering angle ($$\theta$$).
The Physics Behind the Graph
In Rutherford's alpha-particle scattering experiment, the vast majority of $$\alpha$$-particles passed straight through the gold foil with little to no deflection. Only a very small fraction of particles experienced large deflections, and an incredibly tiny fraction (about 1 in 8,000) bounced back almost completely ($$\theta \approx 180^\circ$$).
Mathematically, Rutherford derived that the number of scattered particles $$Y$$ detected at a scattering angle $$\theta$$ is inversely proportional to $$\sin^4\left(\frac{\theta}{2}\right)$$:
$$Y \propto \frac{1}{\sin^4\left(\frac{\theta}{2}\right)}$$
Characteristics of the Correct Graph
When plotting $$Y$$ (Number of scattered $$\alpha$$-particles) versus $$\theta$$ (Scattering angle):
Conclusion
The correct graph is a steeply decreasing, asymptotic curve that starts incredibly high near $$\theta = 0^\circ$$ and flattens out close to the horizontal axis as $$\theta$$ approaches $$180^\circ$$.
If your options include a graph that looks like a sharp hyperbola-like drop (extending from a very high value at low angles to a nearly flat line at high angles), that is the correct choice.
Click on the Email ☝️ to Watch the Video Solution
Create a FREE account and get:


Educational materials for JEE preparation

Ask our AI anything

AI can make mistakes. Please verify important information.
AI can make mistakes. Please verify important information.
