
Join Our JEE Preparation Group
Prep with like-minded aspirants; Get access to free daily tests and study material.
Sign in
Please select an account to continue using cracku.in
↓ →
Join Our JEE Preparation Group
Prep with like-minded aspirants; Get access to free daily tests and study material.
A conducting square loop initially lies in the $$XZ$$ plane with its lower edge hinged along the $$X$$-axis. Only in the region $$y \geq 0$$, there is a time dependent magnetic field pointing along the $$Z$$-direction, $$\vec{B}(t) = B_0(\cos \omega t)\hat{k}$$, where $$B_0$$ is a constant. The magnetic field is zero everywhere else. At time $$t = 0$$, the loop starts rotating with constant angular speed $$\omega$$ about the $$X$$ axis in the clockwise direction as viewed from the $$+X$$ axis (as shown in the figure). Ignoring self-inductance of the loop and gravity, which of the following plots correctly represents the induced e.m.f. ($$V$$) in the loop as a function of time:
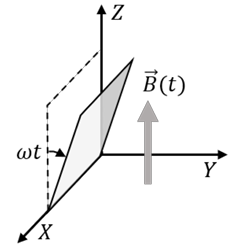
$$\phi = \mathrm{B}_0 \cos\omega\mathrm{tA} \sin\omega\mathrm{t} = \frac{\mathrm{B}_0 \mathrm{A} \sin 2\omega\mathrm{t}}{2}$$
$$\varepsilon = -\frac{\mathrm{d}\phi}{\mathrm{dt}} = -\mathrm{B}_0 \mathrm{A} \cos 2\omega\mathrm{t} \quad \left(0 \le \mathrm{t} \le \frac{\pi}{\omega}\right)$$
$$\varepsilon = 0 \quad \left(\frac{\pi}{\omega} \le \mathrm{t} \le \frac{2\pi}{\omega}\right)$$
Was this solution helpful?
Create a FREE account and get:
_1.webp)

Educational materials for JEE preparation

Ask our AI anything

AI can make mistakes. Please verify important information.
AI can make mistakes. Please verify important information.
