Sign in
Please select an account to continue using cracku.in
↓ →
Join Our JEE Preparation Group
Prep with like-minded aspirants; Get access to free daily tests and study material.
In an experiment, the resistance of a material is plotted as a function of temperature (in some range). As shown in the figure, it is a straight line.
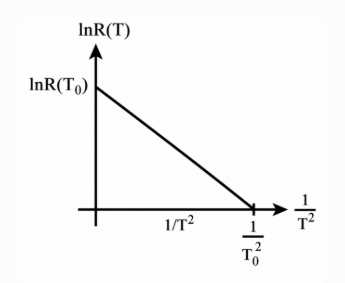
One may conclude that
Step-by-Step Solution
1. Identify the Equation of a Straight Line
From the statement, the graph plotted is a straight line. The standard equation for a downward-sloping straight line with a positive vertical intercept is given by:
$$y = -mx + c$$
Where:
2. Match Axis Variables to the Graph
By looking at the provided mathematical steps:
Substituting these coordinates into the straight-line equation:
$$\ln(R) = -m\left(\frac{1}{T^2}\right) + c$$
3. Convert logarithmic form to Exponential form
To find the direct relationship for resistance $$R$$ as a function of temperature $$T$$, take the exponential base $$e$$ on both sides of the equation:
$$e^{\ln(R)} = e^{-\frac{m}{T^2} + c}$$
Using exponential properties ($$e^{a+b} = e^a \cdot e^b$$):
$$R = e^c \cdot e^{-\frac{m}{T^2}}$$
Let the constant term $$e^c$$ be defined as the baseline resistance $$R_0$$, and the slope constant $$m$$ be defined as a characteristic temperature squared parameter $$T_0^2$$:
Substituting these constants back gives the function:
$$R(T) = R_0 e^{-\frac{T_0^2}{T^2}}$$
Final Answer
The variation of resistance $$R$$ with temperature $$T$$ that satisfies the linear graph is given by the exponential relationship:
$$R = R_0 e^{-\frac{T_0^2}{T^2}}$$
Create a FREE account and get:


Educational materials for JEE preparation

Ask our AI anything

AI can make mistakes. Please verify important information.
AI can make mistakes. Please verify important information.
