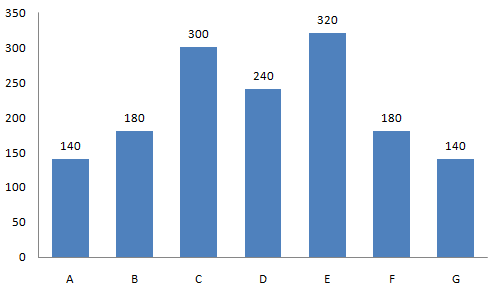
The bar graph shows results of a survey. 1500 people exiting voting booths were asked for which party they voted? Study the diagram and answer the following questions.
Number of voters

Party
Solution
Party C had the second highest number of voters = 300
=> Ans - (A)
Create a FREE account and get:
- Free SSC Study Material - 18000 Questions
- 230+ SSC previous papers with solutions PDF
- 100+ SSC Online Tests for Free

