Instructions
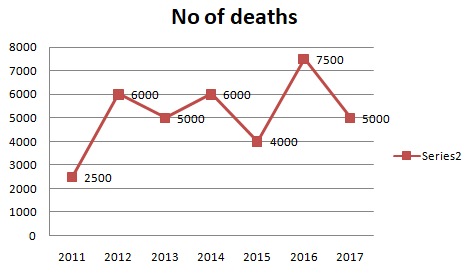
The line graph shows the number of deaths due to road accidents in a certain state. Study the diagram and answer the following questions.
Year
Solution
In 2013, 2015 and 2017, the number of deaths were lesser than that of the previous year.
=> Ans - (A)
Get AI Help
Create a FREE account and get:
- Free SSC Study Material - 18000 Questions
- 230+ SSC previous papers with solutions PDF
- 100+ SSC Online Tests for Free


