Instructions

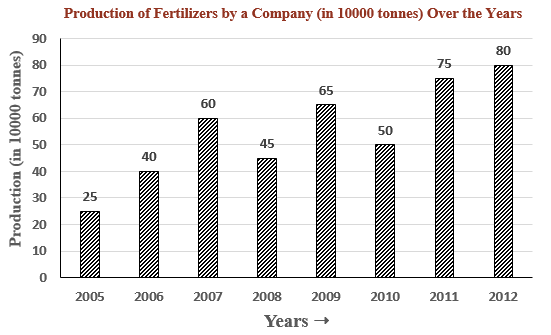
DIRECTION for the question: Study the following bar graph answer the questions given below:

Question 150
In how many of the given years was the production of fertilizers more than the average production of the given years?
Create a FREE account and get:
- Download Maths Shortcuts PDF
- Get 300+ previous papers with solutions PDF
- 500+ Online Tests for Free
