Instructions

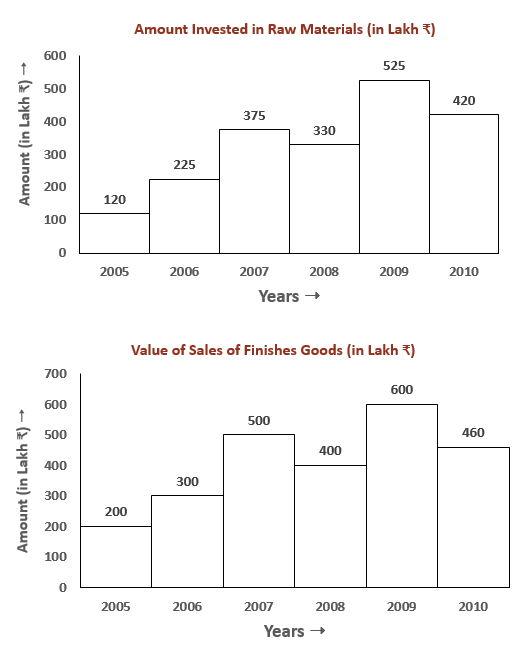
DIRECTION for the question: In the following bar graphs given below, one shows the amount (in lakh Rs.) invested by a company in purchasing raw materials over the years and the other shows the value (in lakh Rs.) of finished goods sold by the company over the years. Study the bar graphs and answer the questions based on them

Question 145
What was the difference between the average amount invested in raw materials during the given period and the average value of sales of finished goods during this period?
Create a FREE account and get:
- Download Maths Shortcuts PDF
- Get 300+ previous papers with solutions PDF
- 500+ Online Tests for Free
