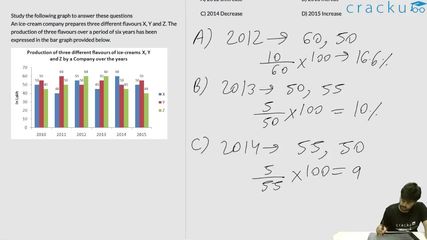
Study the following graph to answer these questions
An ice-cream company prepares three different flavours X, Y and Z. The production of three flavours over a period of six years has been expressed in the bar graph provided below.

For which of the following years, the percentage of rise/fall in production from the previous year is thé maximum for the flavour Y ?
Solution
Percentage decrease in 2012 = 1/6
Percentage increase in 2013=1/10
Percentage decrease in 2014=1/11
Percentage increase in 2015 = 1/10
Percentage decrease in 2012 = 1/6 is the highest
Get AI Help
Video Solution
Click on the Email ☝️ to Watch the Video Solution

SRCC Quant Questions | SRCC Quantitative Ability
SRCC DILR Questions | LRDI Questions For SRCC
SRCC Verbal Ability Questions | VARC Questions For SRCC
Free SRCC DILR Questions
Book Free CAT Mentorship
Get personalized CAT strategy from a 99%iler
500+ students mentored
OTP Verification
Enter the 6-digit code sent to your phone
Booking Summary
Enter OTP
Didn't receive the OTP?


