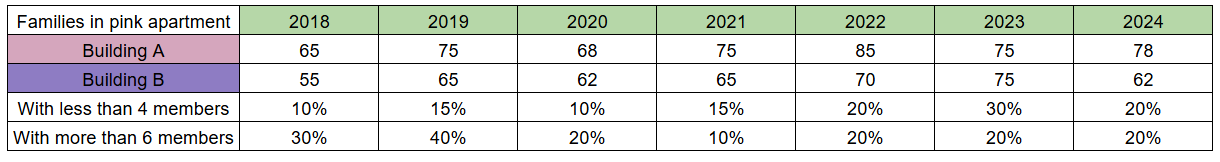
The following table represents data about the number of families residing in buildings A and B of the pink apartment for different years. The table also represents the the number of families with less than 4 members and the number of families with more than 6 members as a percentage of a total number of families in both buildings combined.
Use the data provided in the table above to answer the FOUR questions that follow:
What is the difference (approximate) between the average number of families that stayed in buildings A and B over the given 7 years?
Solution
The average number of families in building A would be $$\frac{60+75+68+75+85+75+78}{7}=\frac{521}{7}$$
The average number of families sin building B would be $$\frac{55+65+62+65+70+75+62}{7}=\frac{454}{7}=$$
The difference would be $$\frac{521-454}{7}=\frac{67}{7}\approx\ 9.5$$
Therefore, Option B is the correct answer.
Get AI Help
Create a FREE account and get:
- Download Maths Shortcuts PDF
- Get 300+ previous papers with solutions PDF
- 500+ Online Tests for Free

Book Free CAT Mentorship
Get personalized CAT strategy from a 99%iler
500+ students mentored
OTP Verification
Enter the 6-digit code sent to your phone
Booking Summary
Enter OTP
Didn't receive the OTP?


