Question 117
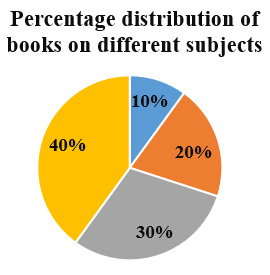
Study the given graph and answer the question that follows.
The given graph represents the percentage of books on different subjects that a person has in his library.

If the total number of books is 60, then what is the ratio of the number of books on subject Cl to the average number of books per subject?
Create a FREE account and get:
- Free SSC Study Material - 18000 Questions
- 230+ SSC previous papers with solutions PDF
- 100+ SSC Online Tests for Free

